This Getting Started text will guide you through the basic steps of using ClueMaker, from the start through selection and import of excel data for your graph.
Intro
Capability to use directly Excel data allows you to quickly import and visualize relations in your excel file. The import wizard lets you quickly define nodes and links in your data and see them in the graph. And for repeated processing of the excel files with identical format, you can use templates containing the nodes and links definition.
Entering License Key
When starting ClueMaker on your computer for the first time, the program will ask you to enter the license key. Depending on how was the key distributed, you either copy its complete string on the field “Enter license key:”, or select the license file at the bottom. Then press the “Load license”.
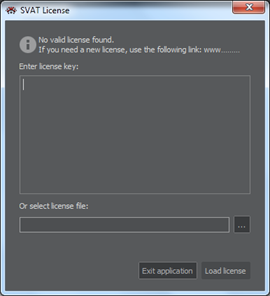
During the period of its validity, the license key needs to be entered only once.
Opening the Workspace
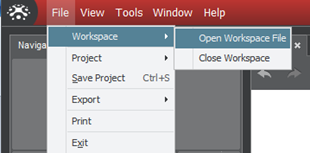
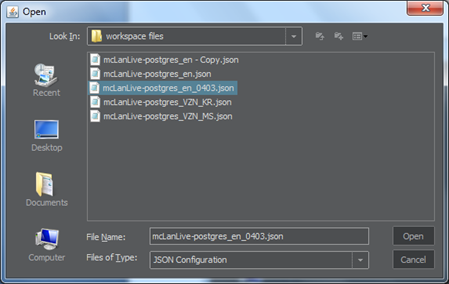
In order to be able to work with predefined databases, you need to select the workspace. For the trial, we provide the workspace file that you copy anywhere on your computer. The function for selecting the workspace is under the File menu.
Import Excel Wizard
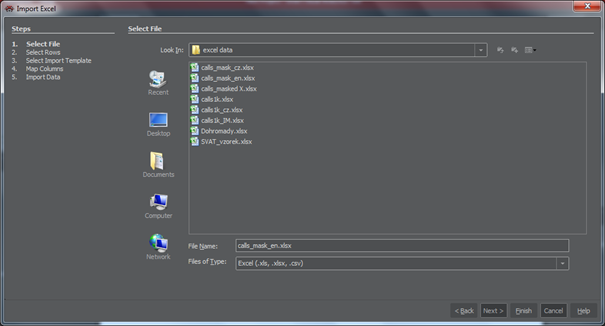
Go to the main menu and select File > Import Excel. The five screens of the import wizard will guide you through the process.
1. Select File: Find and select the file you wish to process, then press the Next button.
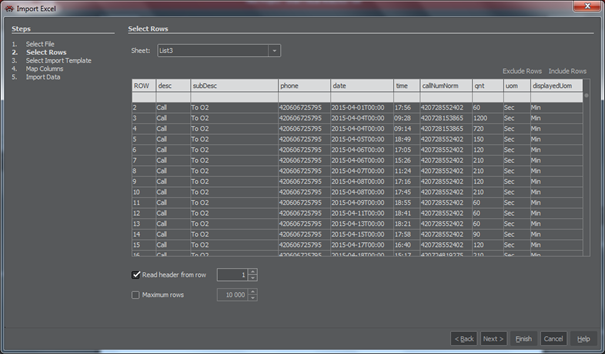
2. Select Rows: The window will show a sample of data from the first sheet of the excel file. The pane allows you to select a different sheet and to specify whether your file has a header. You can also limit the maximum number of rows to import. In some cases you may want to exclude certain rows from import by highlighting them and and clicking the Exclude Rows button. Then press Next.
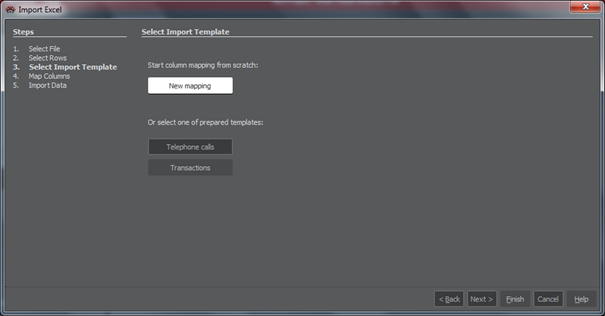
3. Select Import Template: This pane offers a choice to proceed with the New mapping or to select one of the templates. After making your selection, press Next.
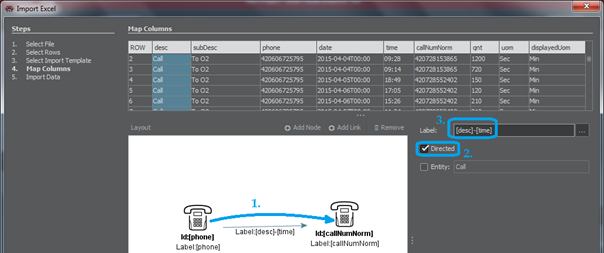
4. Map Columns: In the case of new mapping, the pane opens with the Layout window empty. For each node we want to see in the graph, we click on the +Add Node, then on the canvas. For each new node we select the proper entity type from the field Entity.
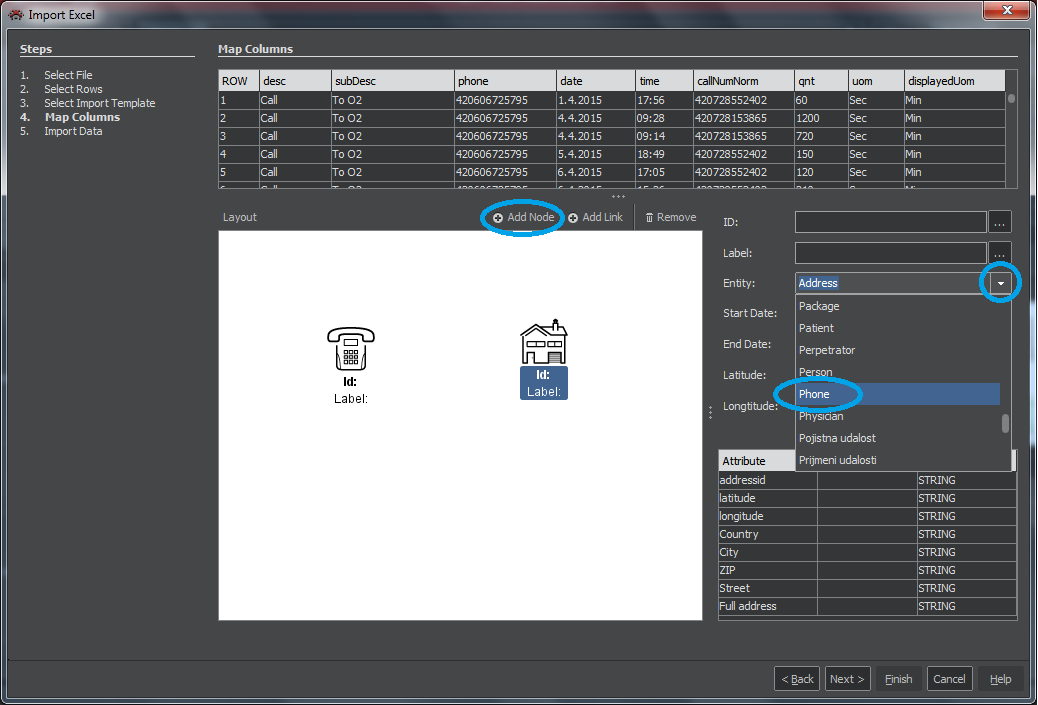
We also need to specify at least the ID and label. This could be done by clicking on the column of data we want to use for it, and dragging it over the icon. This sets the same attribute for the ID and label. Alternatively we may write the column name in the square brackets directly in the ID or Label field. This way we can combine two or more attributes or include a fixed text as demonstrated further.
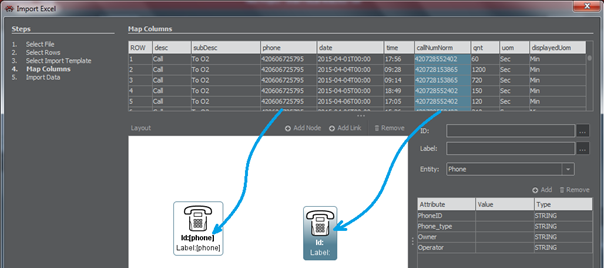
To set up links, press +Add Link, then drag the line from one icon to the other as shown on the next picture (1.). To keep the direction of the link, mark the Directed (2.). The Label is optional, on the picture we set it up with two attributes separated with a dash (3). Press Next.
5. Import Data: The pane will show a number of imported nodes and links. It also offers the option of saving the current setting as a template. This is also the last place in the wizard where you can use the Back step.
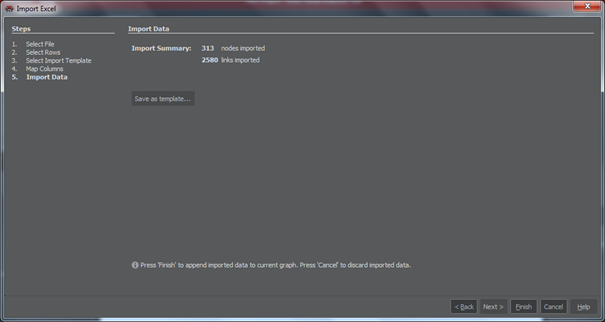
Pressing the Finish button will conclude the import and show the data in the Graph.
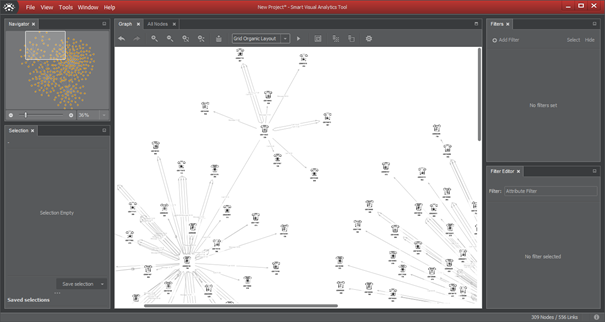
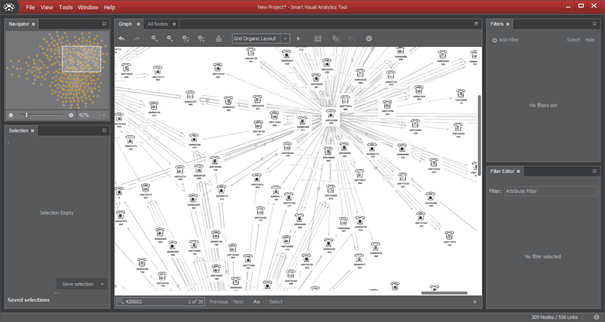
Working with the Graph pane
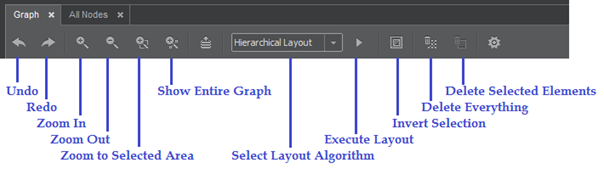
After loading new items, the graph may look messy and often some items do not fit in the pane. The horizontal menu of the Graph pane offers several functions to deal with it.
TRY OUT
Make sure all elements are visible on the Graph pane. Try different layout algorithms.
Let’s highlight the person (xxx) and search all related entities. (Search related > Search Everything).
- Try the various types of layout to arrange the graph.
- Try zoom using buttons or mouse wheel.
- Move the entire graph by dragging it with the right mouse button.
- Move the visible area by dragging the rectangle in the Navigator pane.
- Delete selected items
- Use Undo to get deleted items back.
Search Strings in Graph
Ctrl-f will open the field for the string search. As soon as you start typing in that field, the number beside it will show the count of discovered items containing the string. You can step through them using the buttons Next or Previous – when pressed, the matching item will display in the middle of the graph. The Select button will mark the items as selected.
TRY OUT
Search for the telephone number. Type in slowly a number (e.g. 420606725) and watch as the matching nodes in the graph are being highlighted. With only a few nodes marked, try Next and Previous buttons.
Filtering
Filters are added, deleted, activated or deactivated in the Filters pane. The Filter Editor pane is used to enter the filter type and its criteria.
ClueMaker provides the following filters:
- Entity Filter: filtering one or more entity types.
- Attribute Filter: filtering a selected entity type based on values of one or more attributes.
- Degree Filter: filtering based on number of neighbours or edges (=links. There could be multiple links between two nodes) of each node in the graph.
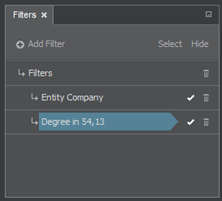
The filters could be combined in logical OR or AND fashion. The picture below shows the OR arrangement, the filter will select all companies as well as all items with 54 or 13 links.
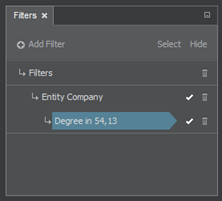
The following picture shows the AND arrangement, set up by dragging the Degree filter over the Entity filter. The filter will select only the companies with 54 or 13 links.
TRY OUT
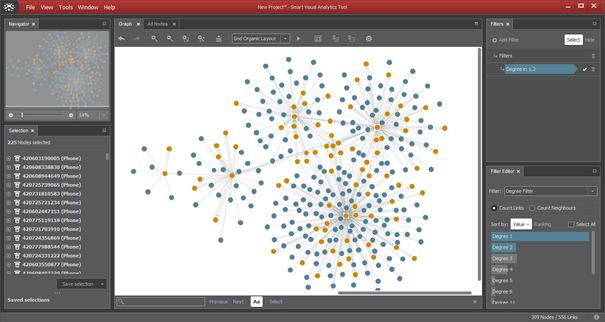
In the Filter pane, click on +Add Filter.
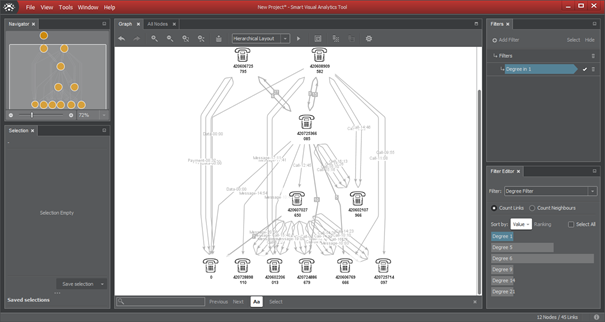
Then, in the Filter Editor, select the Degree Filter, in the Filters pane, and find all nodes with 4 links or less. Click Select and then Hide, to see the effect on the graph.
With these nodes selected, delete them from the graph. Try different layout types. A magnified result of the hierarchical layout may be similar as the following picture.
Group/Ungroup Links
If two nodes have more than four links (of the same direction) the links appear as one thicker line with the number of links it represents.
The Ungroup function lets you to see the individual links. Click on the link with the right mouse button and select “Ungroup”.
The Group function lets you group any number of links between two nodes by selecting any of the links between the nodes, clicking the right mouse button and selecting “Group”.
Saving and Retrieving Selection
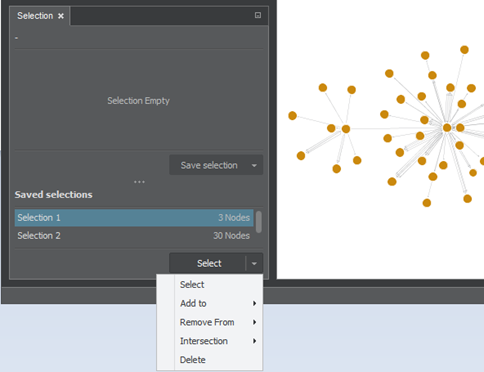
There are several methods for selecting (highlighting) items in the graph. We often need to save those selections and to return to them later. This is accomplished in the Selection pane. The top portion of the pane always shows the current selection – the names of items that could be expanded to show details. The button Save selection is used to store the current selection. The selection is added on the list of saved selections at the lower portion of the pane, and given the name “Selection n”, where n is a sequential number. You may rename it by clicking on it and entering a new name.
TRY OUT
Pick one node in the graph and using the right mouse button, select all incident nodes.
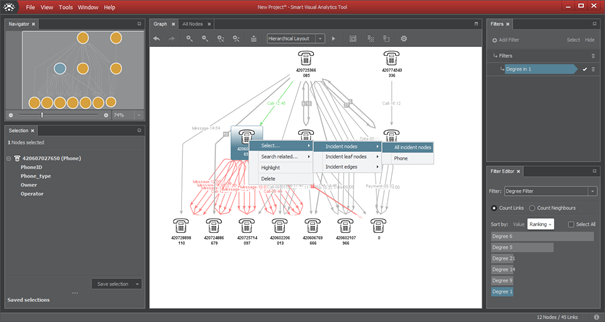
Your selected nodes will appear in the Selection pane:
Use the Save selection button to store it.
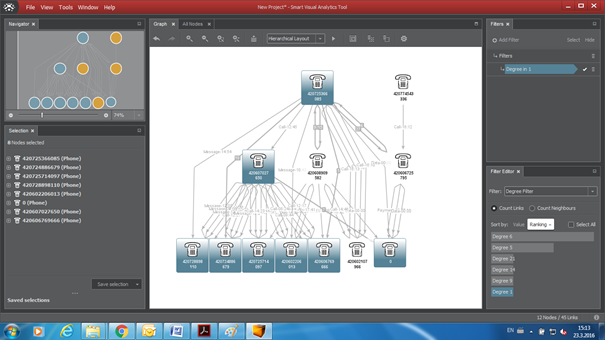
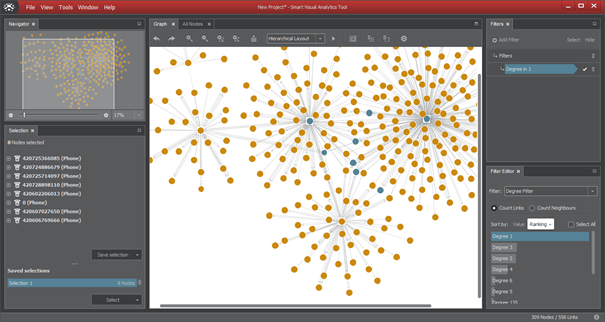
The saved selection with all its nodes remains stored as long as its items exist in the graph (if they were not deleted). Let’s try to step back in the graph, to the state before we used the filter to delete most of the nodes. Use the Undo button (the left arrow in the Graph menu) few times, until you get all nodes back.
Then, in the Selection pane, highlight the stored selection (Selection 1) press Select button. The graph shall highlight your selected nodes, similarly as on the following picture.
During your work, you may have saved several sets of selected items. The Selection pane offers various possibilities for work with multiple selection sets:
- Add to: it will add the items of the highlighted set to the designated set.
- Remove from: it will remove items that match the highlighted set from the designated set.
- Intersection: it will leave only those items in the designated set that match the highlighted set.
TRY OUT
Using any method, make other selections and save them. Try all the commands for working with multiple selection sets.
At the end create one selection set with the nodes of your choice, have it displayed in the graph and delete all other items.