Introduction
This guide provides basic information for use of ClueMaker v.2.0. visualization tool. It begins with the installation and the first launch of the tool. Following chapters describe the import of data and various possibilities of work with the imported data set.
Basic Terms
- Attribute: A database field such as the surname, date, bank account number...
- Entity: In general a set of information related to an object - a person, company, contract, bank account... In the graph, the entities are represented as nodes and specific type of links.
- Node: A key element of the graph that represents a data entity (a person, company, account ...) for which we search for links to its neigbours.
- Link: An expression for connection or relationship between two nodes. It si not necessarily only a technical connection, the link could bear a number of attributes, similarly as the node. (A good example is the bank transaction - the link between two accounts that also contains attributes such as the amount, currency, date ...)
- Neighbour: A node which is an immediate neighbour for a given node.
- Leaf: For a given node, leafs are the neighbours that do not have any further links.
- Label: A text accompanying graphic images. It may contain one or several attributes, a fixed text or combination of both.
Installation
Requirements
Visualization tool is intended for Windows from the version 7 SP1 up. For uninterrupted and problem free operation the system needs JAVA 1.8 and at least 4GB RAM. The minimum recommended monitor size is 19’’ with 1200x1024 resolution. For larger volumes of data, the larger memory as well as the monitor size and resolution is recommended.
Installation and First Start
For the Windows environment, the application can be distributed in the way that does not require administrator rights. In this case you need to unzip the installation package in any folder on you computer. ClueMaker is then launched by starting either cluemaker.exe, or cluemaker64.exe for 64 bit processors. You'll find them in the ../cluemaker/bin directory.
The other distribution option is the installation package for the automated installation. At the end of automated installation, the package will place the application icon on the desktop and in the start menu.
License
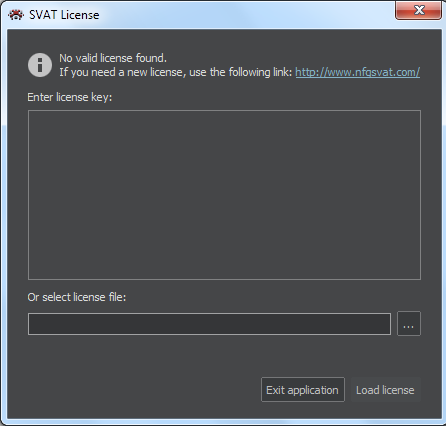
For validation of licence, ClueMaker 2.0 uses a text key distributed to authorized users. When starting ClueMaker on your computer for the first time, the program will ask you to enter the license key.
Depending on how was the key distributed, you either copy its complete string on the field “Enter license key:”, or select the license file at the bottom. If the key was correct, the license expiration date will appear at the bottom of the pane. Then press the “Load license”. The License window will close and the application is ready for use.
Workspace
The workspace contains a definition of data sources and entities we use for analytical work. it must be selected at the beginning of the session. The function for selecting the session is in the main menu under File > Workspace > Open workspace. Using the standard window for browsing/selecting files we select a required workspace file. (The workspace files have the suffix .sws .)
Alternative Launching Methods
Beside the most common launching - by clicking the icon of the application - we can start application and open workspace or saved project in one step:
- By dragging and dropping the workspace file (.sws) or project file (.spr) on the application icon or its shortcut.
- By using the command line in the cmd.exe window:
- ./cluemaker64.exe –o [pathname of the file]
- ./cluemaker64.exe --open [pathname of the file]
- ./cluemaker64.exe [pathname of the file]
Work Area
Upon the start, the application will display an empty work area, subdivided into panes with various functions, and the graph area. The following figure shows the basic layout.
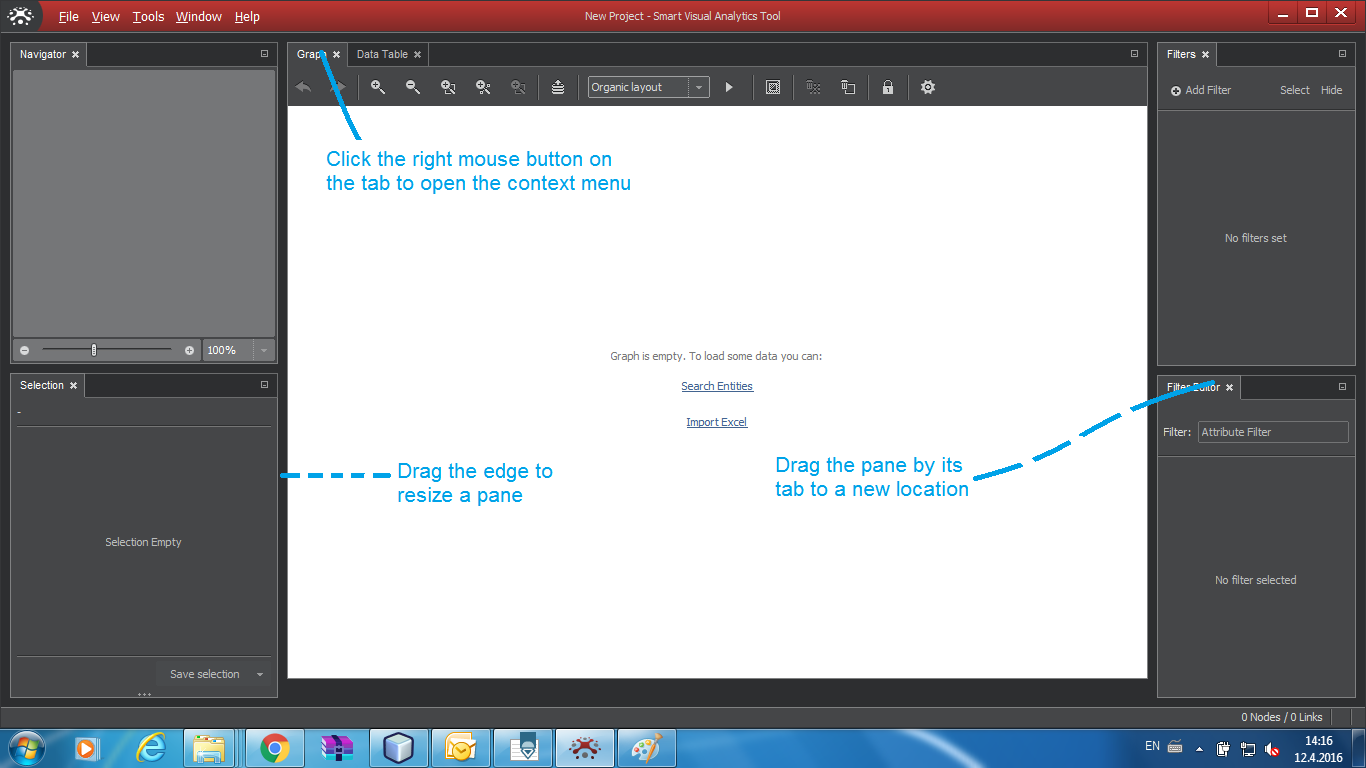
The size of panes could be changed by dragging their edge. You can also rearrange panes or release them from the main window group - "float" in the ClueMaker parlance.
Floating Window
The Float function will detach the pane from the window group and show it as an independant window that could be placed on the second monitor. The reverse is the Dock function. Both functions can be found in the context menu opened with the right-click on the tab of the pane.
Moving Window
The window of each pane can be moved to a new location in the main window by dragging by its tab. During the move, a white rectangle shows an approximate placement of the window if dropped. Before full familiarization with the application we recommend to leave the panes in the initial location, for better conformity with the guide.
Import of Excel Data
The Import Excel function makes the import, including the nodes and links definition, an easy process. It supports both the ad-hoc load of suitable excel files and definition of new nodes and links as well as using stored schemas for repeated imports of files with identical format.
Import Wizard
The Import wizard is started from the main menu: File>Import Excel. It will guide us through five screens:
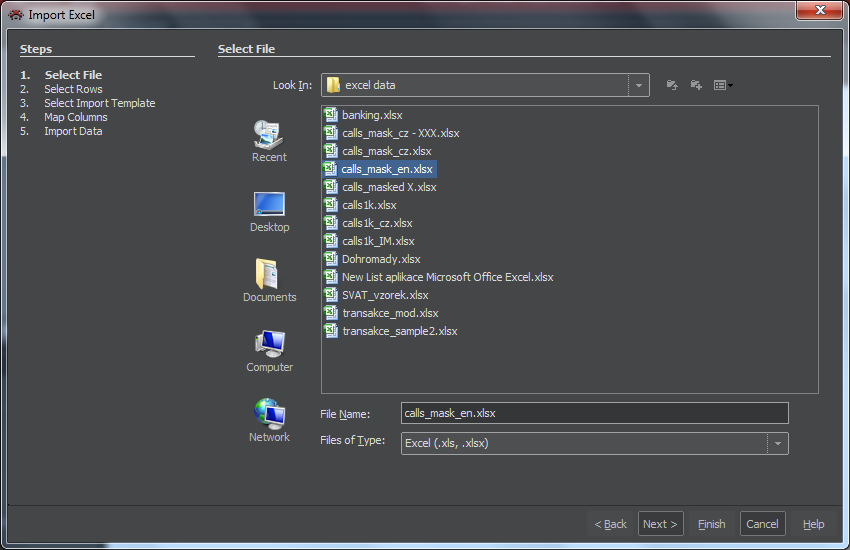
Select File
We will find and select the file to be imported, then press Next..
Select Rows
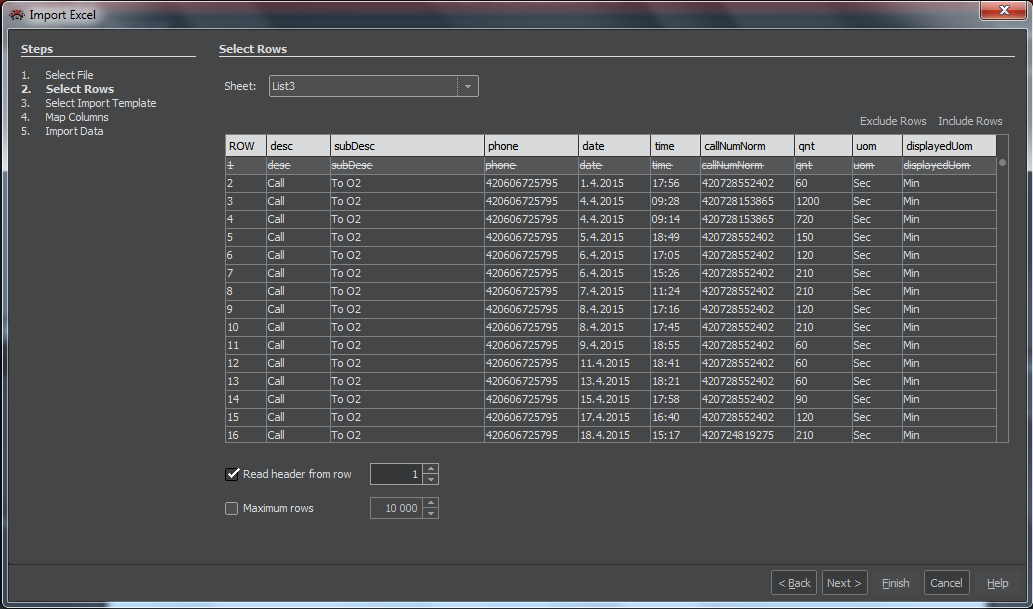
The window will show a sample data from the file we selected. We can scroll through the file, the sample may contain a maximum of 2000 lines.
- If the file has a header, we'll mark the "Read header from" and specify a number of header lines.
- By marking "Maximum rows" and specifying a number of lines we can limit the volume of data to be imported.
- Using the click, Ctrl-click or Shift-click for multiple lines, we can mark the lines and exclude them from the import by pressing the Exclude Rows button. The Include Rows button puts them back in the import set.
Select Import Template
In this step we select either one of the stored templates or the option to Enter new mapping from scratch. Then press Next.
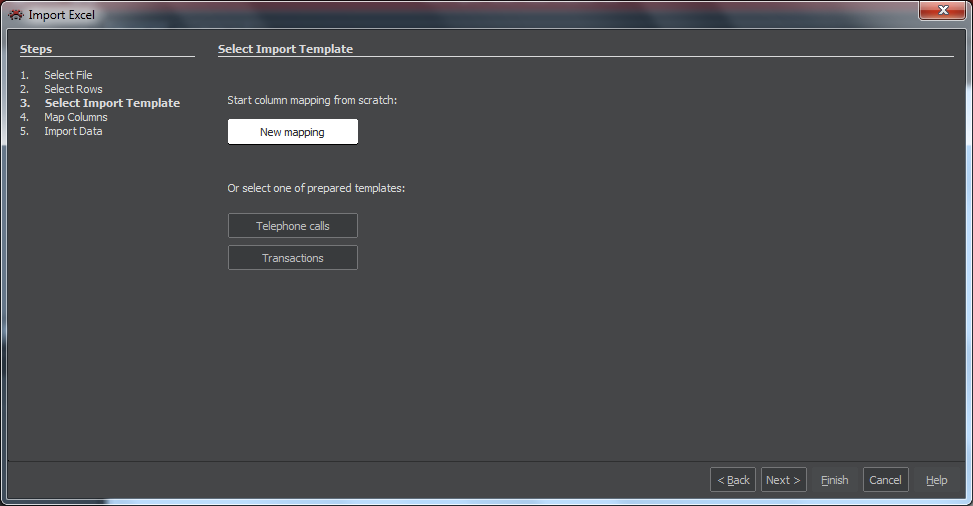
Map Columns
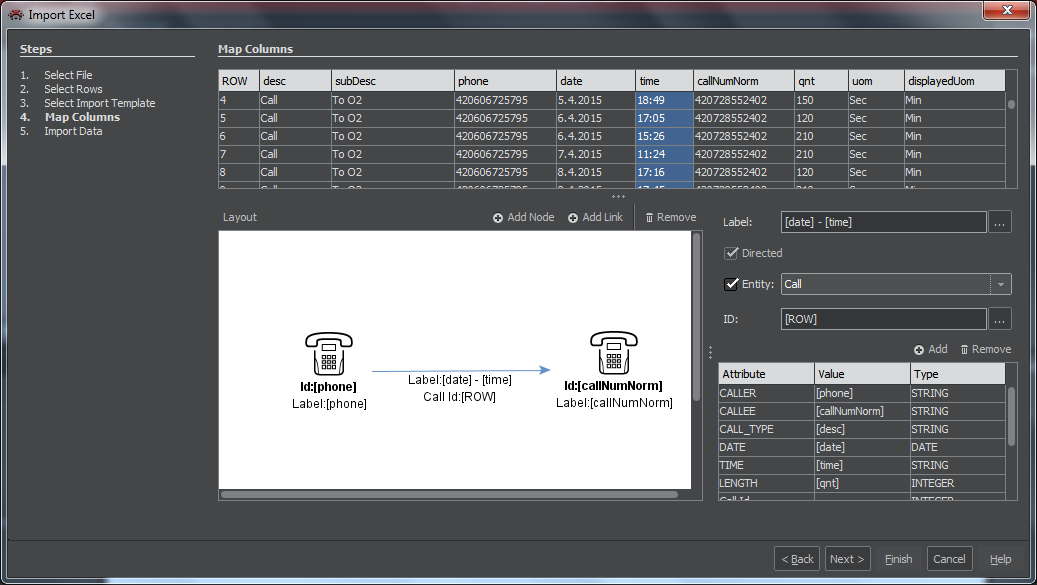
If we picked a stored template, the window in this pane will show the stored nodes and links and we can skip to the step d). In case of new mapping, the window is empty. We then:
- By selecting +Add node and then clicking on the canvass, we add the default node icon. We repeat it for all nodes we need.
- For each node we define the type. We highlight the node by clicking on its icon, then in the field Entity we select a suitable type (e.g. "phone") from the list. This will show the proper icon and, to the right of canvas the predefined attributes.
- By selecting +Add link and dragging the line from one icon to the other, we create a link. Beside the canvass we can mark the link as Directed.
- We need to set at least the Id and Label for each node. It can be done by :
- Dragging the column we want to use onto the icon. This will set the same attribute both for Id and Label.
- Dragging the column onto the field Id or Label to the right of the canvass. Optionally we can write the column names in square brackets to the required field. This way we can combine several attributes or/and add a fixed text as in the example: [Caller] – [Date] .
- For other attributes we want to see, we map the column to the entity attribute by dragging the column to the attribute field of our choice. Or we can write the name of the column in square brackets in this field.
- We can complete the definition of link. A click on the link will show the link data on right of the canvas. The following information is optional: By placing a checkmark in the field Directed we say the link is directional. By placing a checkmark in the field Entity we say the link is an entity with attributes. In that case we must define at least its Id. This, as well as optional attributes for the entity-link, we define the way described under e).
Caution: The Id definition is very important. All lines (entities) with the same Id will be shown in the graph as one node. Poorly chosen combination of Id and Label can be misleading in the graph. here are few examples:
| Example A | Example B | Example C | |||||
|---|---|---|---|---|---|---|---|
| Lines in file | Id | Node Labels | Id | Node Labels | Id | Node Labels | |
| Caller | City | [Caller] | [Caller]-[City] | [Caller]-[City] | [City] | [City] | [Caller]-[City] |
| 606707808 | Praha | 606707808 | 606707808-Praha | 606707808-Praha | Praha | Praha | 606707808-Praha |
| 606707808 | Wien | 606707808-Wien | Wien | Wien | 606707808-Wien | ||
| 545000111 | Berlin | 545000111 | 545000111-Berlin | 545000111-Berlin | Berlin | Berlin | 545000111-Berlin |
| 545000111 | Praha | 545000111-Praha | Praha | ||||
| 545000111 | Wien | 545000111-Wien | Wien | ||||
Example A: For five lines in our file, we'll see only two nodes with labels containing the caller and city from the first found record. Can be misleading.
Example B: We will see all five nodes in the graph. But the labels show only the city. While corect, the same label repeats, and does not show the caller.
Example C: In this case, the graph will contain three nodes - one for each city. But nodes Praha and Wien represent two callers each, but shows the number of only one. Misleading!
Press Next when complete.
Import data
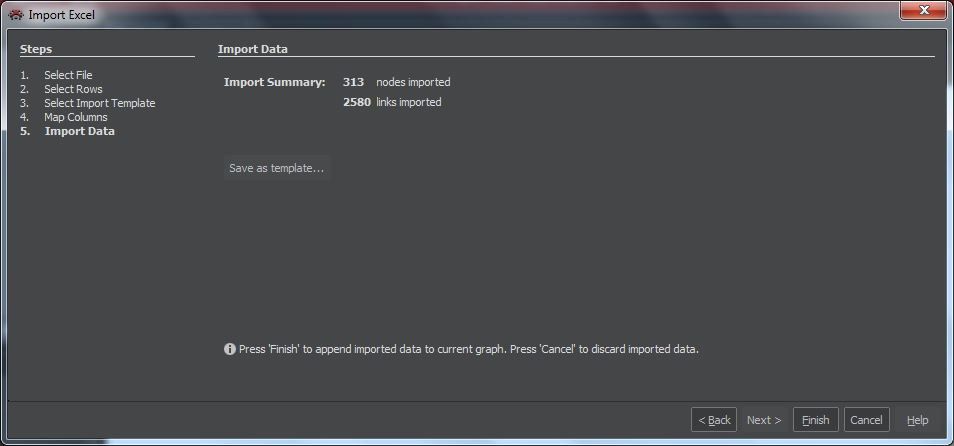
The last window of the wizard shows a number of imported nodes and links. It also offers a possibility to save the defined mapping as a template for repeated use. Pressing the Finish button will close the import wizard and show the result in the Graph.
Working with Excel Data
Unlike working with database data, for nodes imported from an excel file the search for further links and nodes (with the Expand Nodes function) is not available. After the import, the graph and data table contains all nodes and links as per the mapping definition. If you have deleted some nodes from the graph and you want them back, you have to use the Undo button. All the rest is the same as working with data sourced from a database.
Import from Database
We start the import process by selecting the function Search entities in the Graph pane menu :

The window Search entities will be displayed.
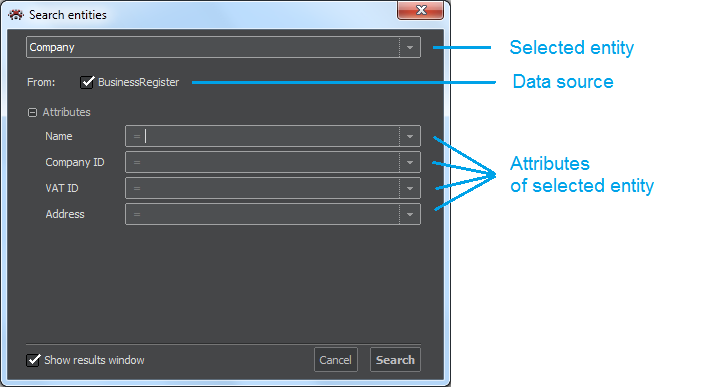
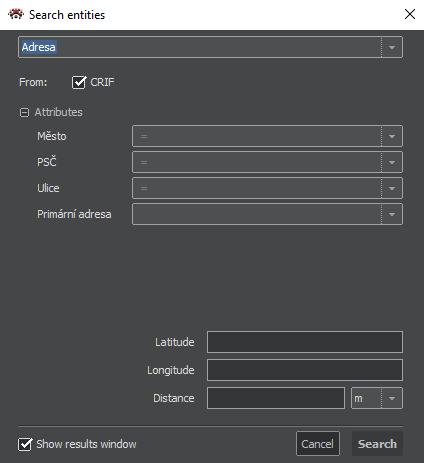
Selection of entity: In the top field, a click on the arrow will reveal a list of available entities, from which we select one. The "From" line will show all available data sources for the entity, and below it, a list of attributes available for search will be shown.
Selection of data source: The selection of the data sources used for import could be narrowed using the checkmarks.
Selection of attribute values: For each attribute, we can specify one exact expression, a mask - the string that could appear anywhere within the expression we are searching for, or the list of exact expressions. These possibilities are set for each attribute by clicking on the arrow on the right side of the attribute field. A default is ‘=’.
- An exact expression is written directly in the attribute field after ‘=’. A mask uses the percentage sign ‘%’, which represents any number of characters. For example the mask ‘Prof%t’ will pick not only ‘Profinit’ but also ’Profi soft’, or ’Prof. JUDr. Karel Podešva, advokát’ and others. Please note that not all data sources support masks.
- A search string is written following the option designator "Include".
- A list of expressions is written after selecting "In" option.
In the latter two cases, ’%‘ does not have meaning of the wild card. The conditions set for several attributes will be resolved using the logical AND – all conditions must be evaluated as true. Case sensitivity of search depends on a particular data source.
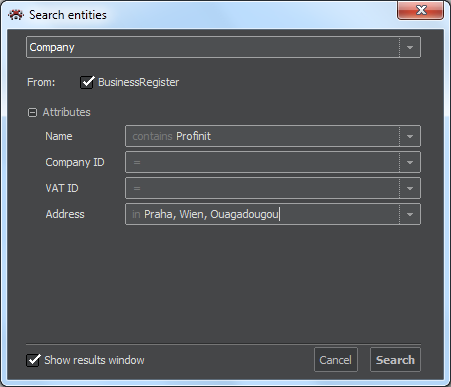
The above example with the search based on two attributes, would found those items that have the string Profinit anywhere in the name and one of the listed city names as the only text in the address field. After setting all search parameters, we press the Search button. The Search result window will show a list of found entries. The list can be sorted by clicking on the column heading. Another click will reverse the sort order.
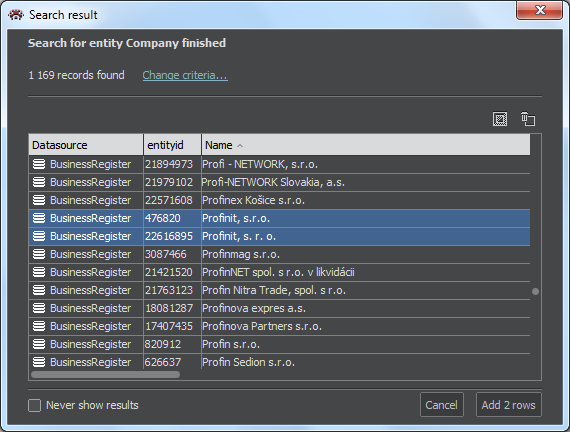
The button Add … rows shows a number of lines to import. To select only certain lines, we mark them by clicking the line. With Ctrl-click we can mark several lines and Shift-click lets us select all lines between the two marked.
The Add...rows button then executes the import in the graph. The import can be repeated with various selection settings, each successful import adds new nodes in the graph.
Import metadata
Import metadata functionality serves for import of selected information about files from chosen folder. Graph will be created, in which there will be shown information about files connected in parts that are identical.
Importer Wizard
Picking folder for import
Pick desired folder in window and press button Next.
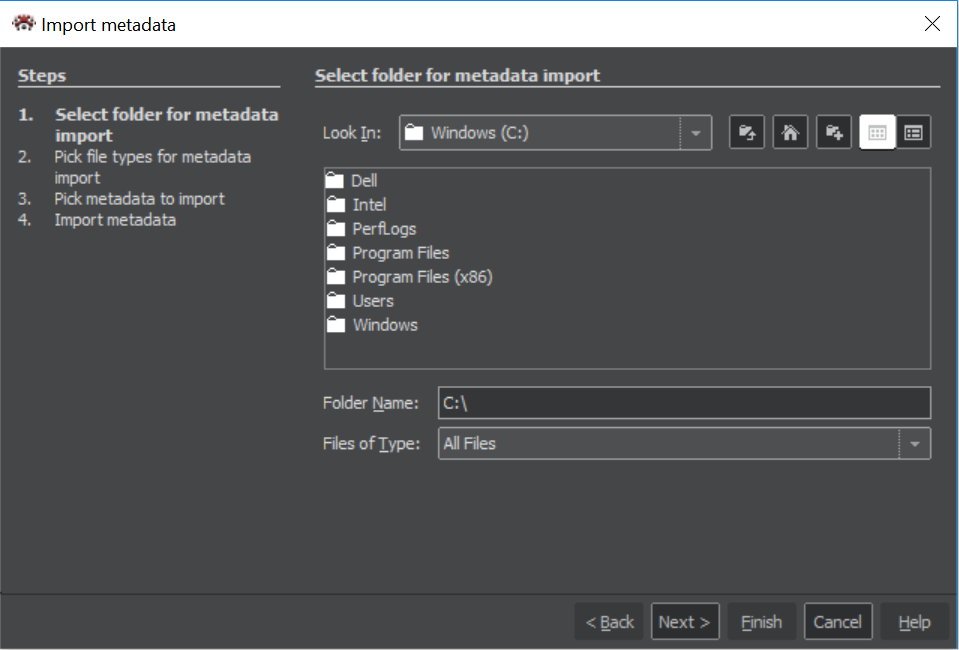
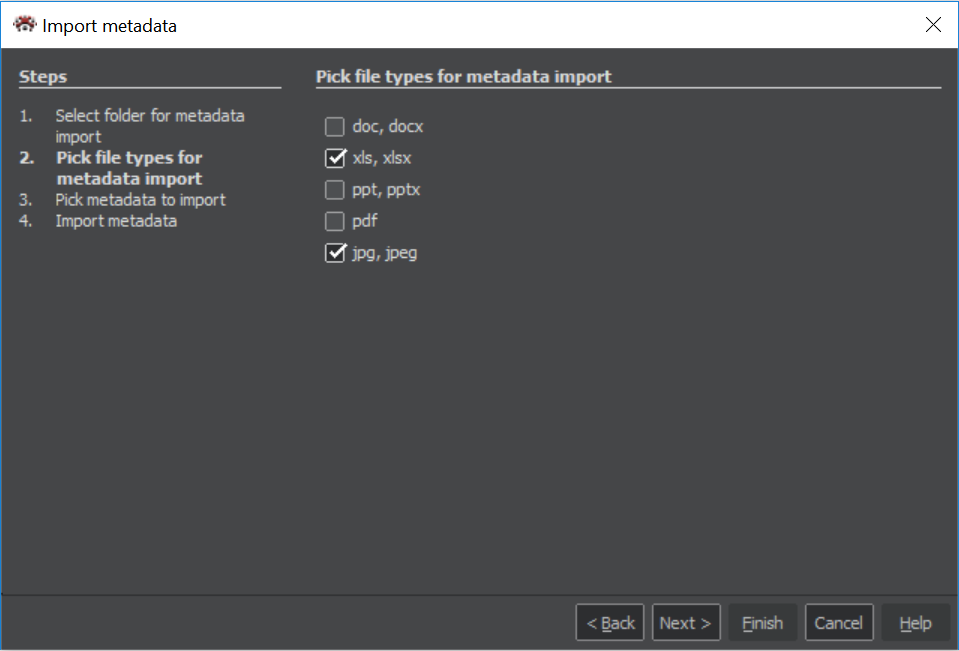
Picking folder types
Here we pick filetypes of our interest and press button Next.
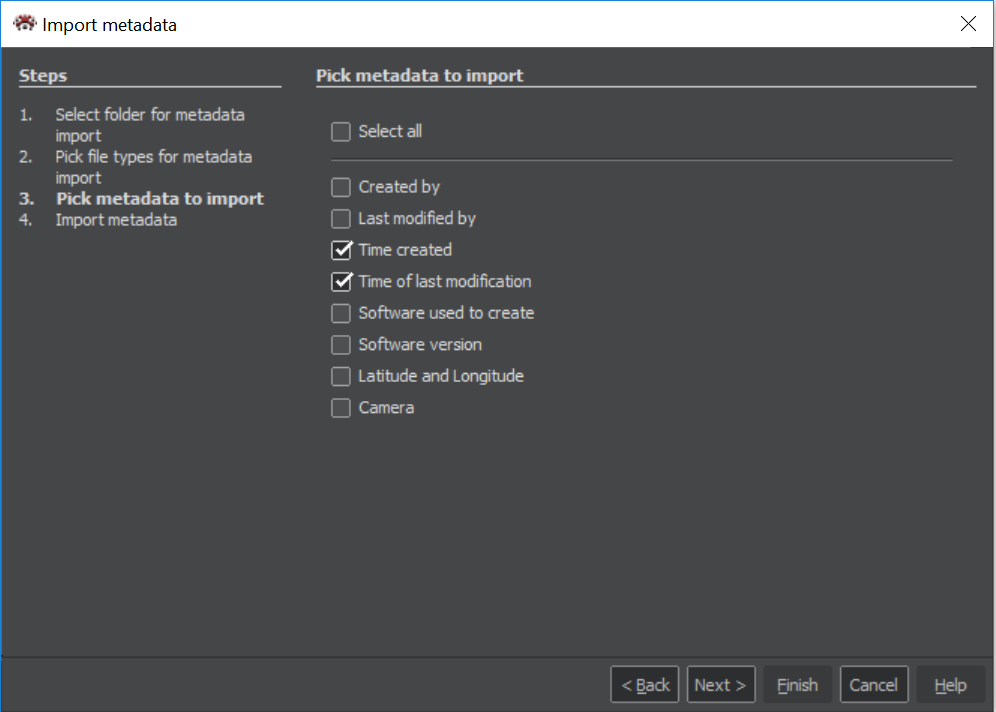
Picking metadata types
On this window we select metadata types, we want to import and press button Next. There is also a checkbox for selecting all metadata types. Some of the metadata will show themselves as node in graph, some only as atribute.
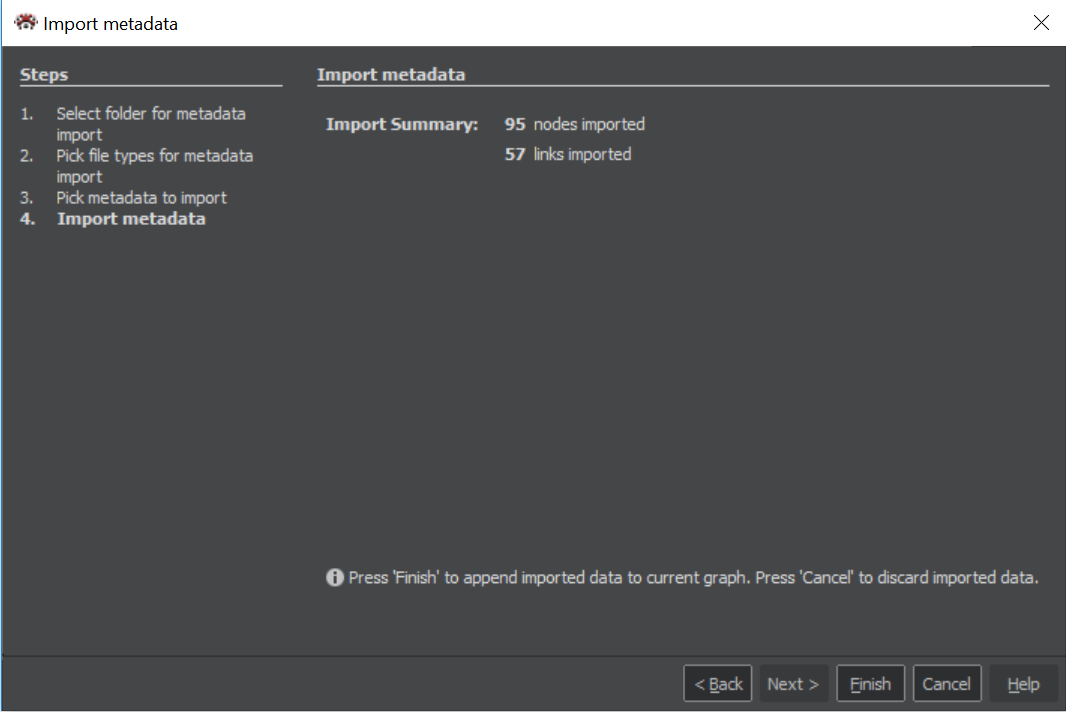
Import result
The last window of the wizard shows a number of imported nodes and links. Pressing the Finish button will close the import wizard and show the result in the Graph.
Import Outlook mailbox data
Import Outlook mailbox data allows you to import mails and e-mail communication participants according to settings acquired during import wizard. Graph will be created, in which there will be shown mails connected with their senders and recipients.
Importer Wizard
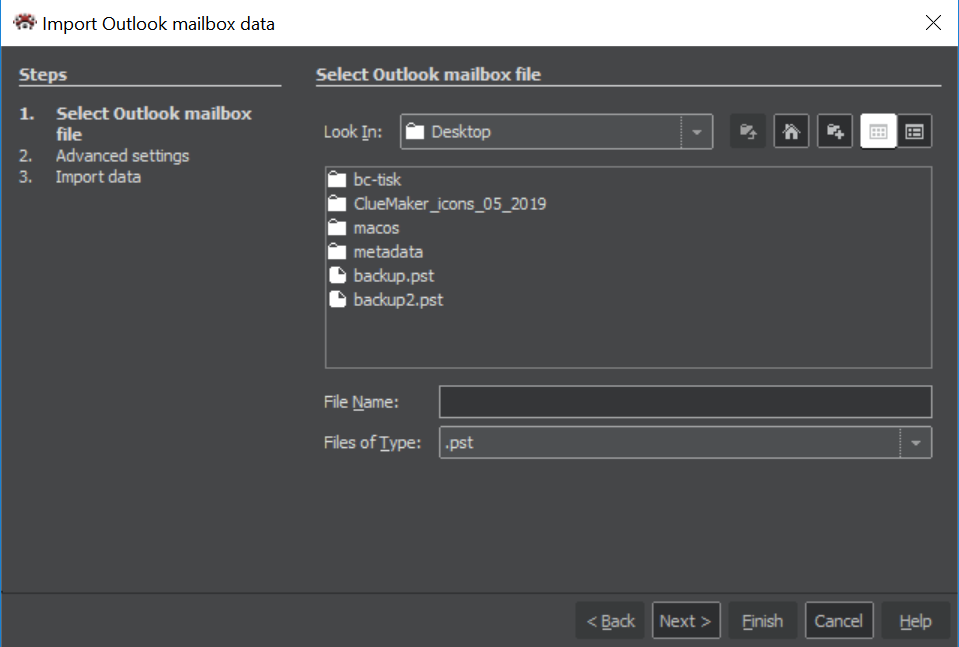
Výběr souboru pro import
Pick desired PST file (.pst suffix) for processing and press button Next.
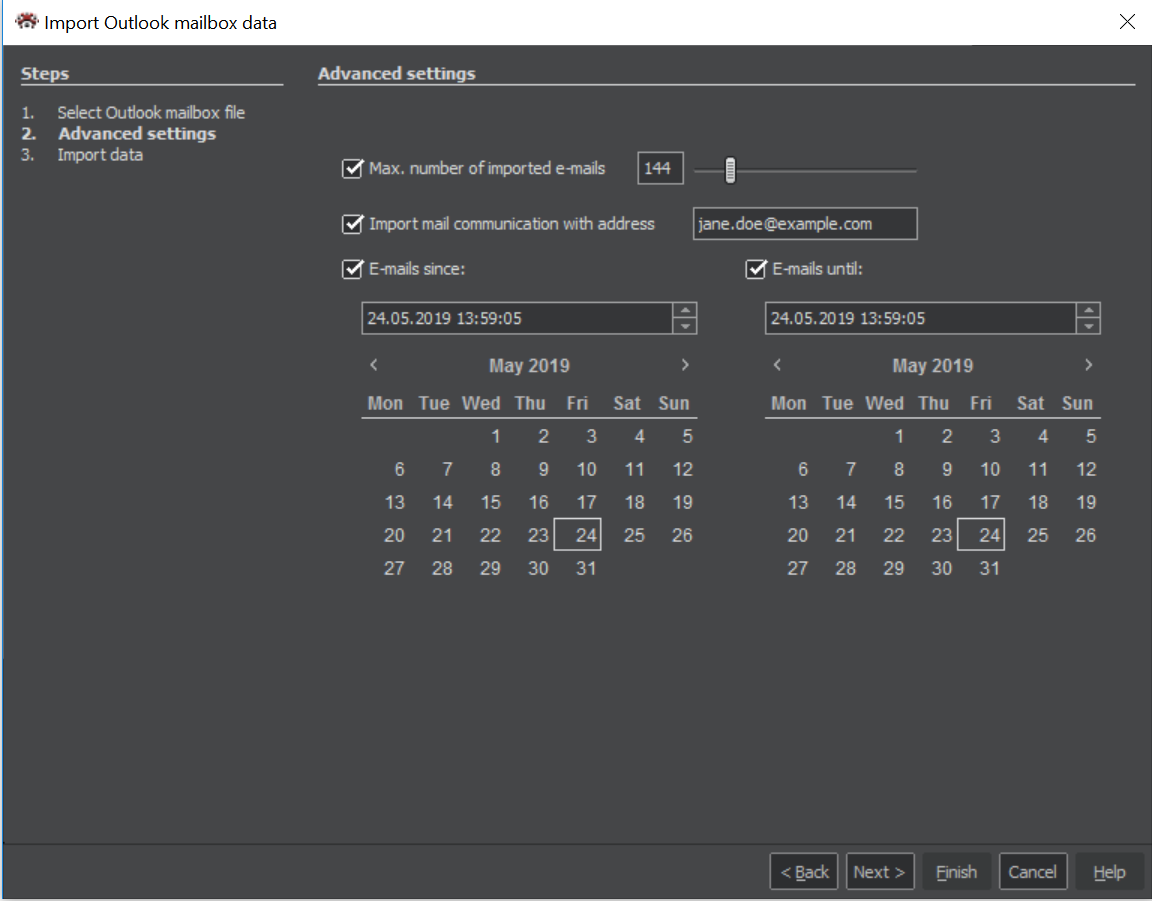
Import Settings
Here you can customize, how many e-mails should be processed, which e-mail address is in your interest, or requested date range and then press Next button.
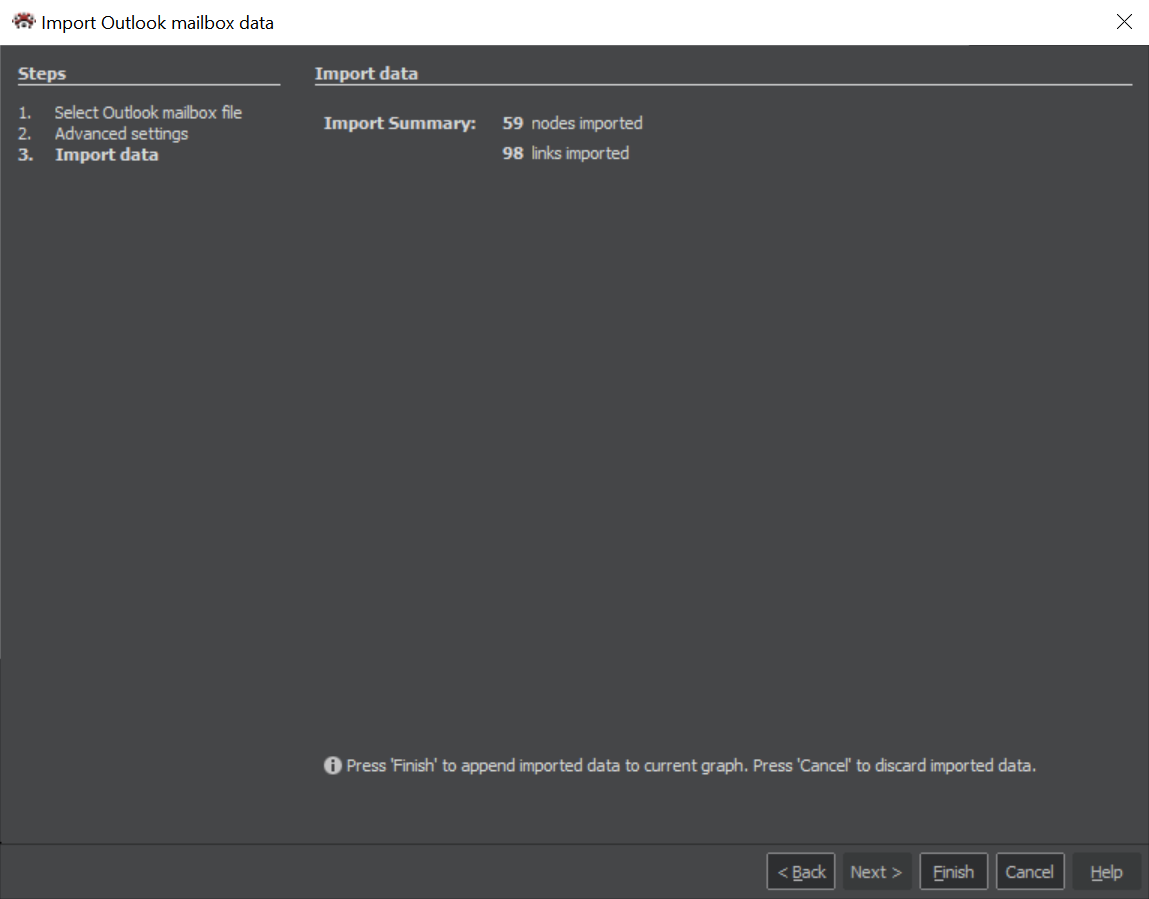
Import result
The last window of the wizard shows a number of imported nodes and links. Pressing the Finish button will close the import wizard and show the result in the Graph.
Working with Graph
This chapter deals with the controls of visualization, search for linked nodes, saving the selection and other topics concerning the image.
Graph Display Control
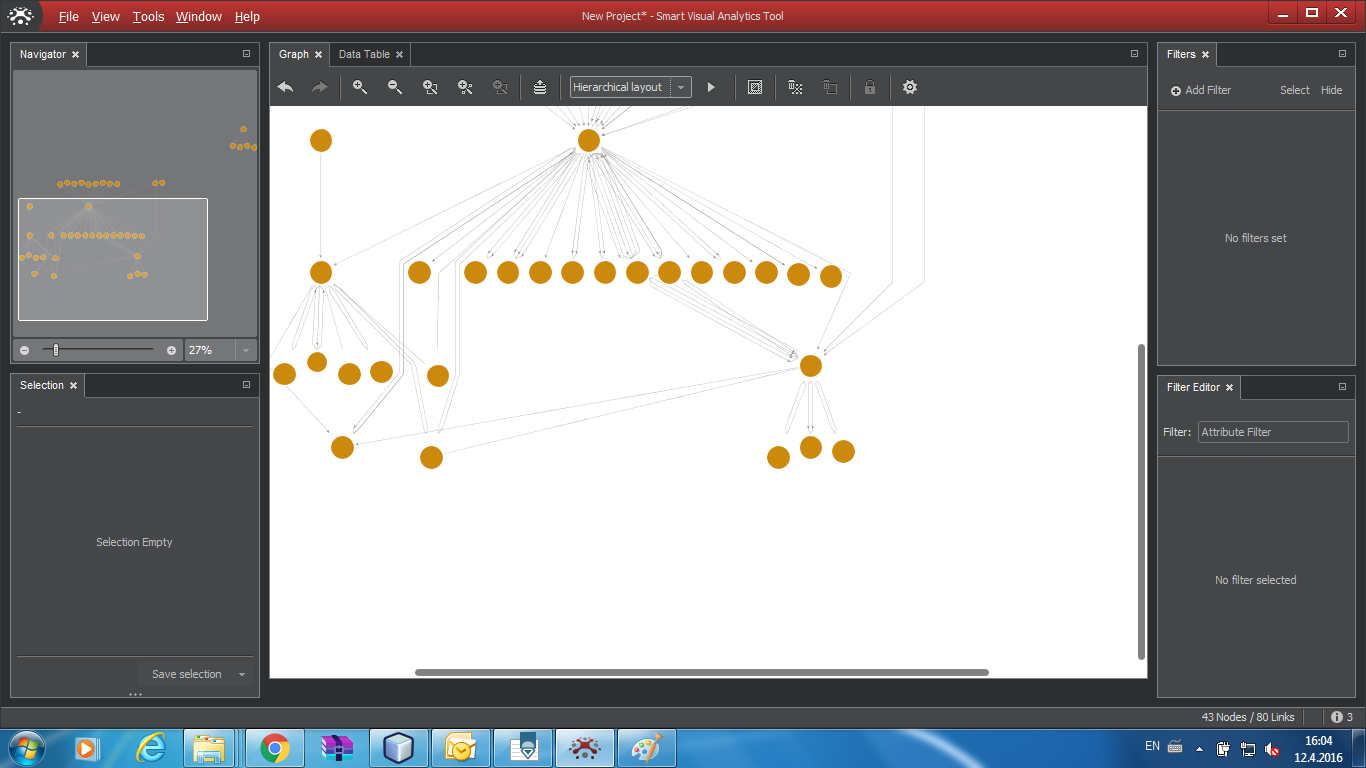
For controlling the graph display, we use functions called from the menu in the Graph window shown on the following figure. We also use the mouse and the Navigator pane.
Using Mouse in Graph
Mouse wheel is used to zoom-in/out the image.
The left mouse button is used for marking items in the graph - selecting them for further action. With Ctrl-click we mark multiple items (nodes) while the rectangle drawn around nodes will mark all inside it.
The left mouse button kept pressed on any selected entity allows us to drag this entity together with all other selected entities to a new location.
The right mouse button kept pressed anywhere in the graph allows us to move the entire graph.

Graph Menu Functions
Undo: returns graph one step back. It also activates the Redo function, however, any changes in the graph set it to the 'current' state and Redo is deactivated.
Redo: restores a step previously undone.
Zoom in: close up the image
Zoom out: move away the image
Zoom to selected area: - first press the button, then mark with the mouse the area to zoom in.
Show entire graph: - this will show in the canvas all entities, zooming out if necessary.
Select layout algorithm: Pull down menu offers several display algorithms. A selected algorithm is launched with the button Execute layout.
Invert selection: selected items will become deselected and vice versa.
Delete everything: clears the graph. If done mistakenly, use Undo function.
Delete selected elements: deletes selected items only.
Navigator Pane
The Navigator pane is linked with the Graph pane, its task is to make easier the navigation in large graphs which are hard to fit in the graph window . The Navigator shows the entire graph with the rectangle that marks the portion of the graph displayed in the Graph window. Dragging the rectangle in Navigator moves the area shown in the Graph and conversely, changing the displayed area in the Graph window (by zooming-in/out or dragging the image) will change the size/position of the rectangle in the Navigator.
Expanding Search
In a typical task, we have marked some nodes and want to find more links to other nodes for them. The Expand nodes functions look in the data source for immediate neighbours of selected nodes. If we want to expand the search further, we do another search for marked nodes.
In the graph, we select the nodes for which we want to find more links. Over any of them we press the right mouse key and from the menu select "Expand nodes" and then one of the following options: New search, Search all or Active links.
New Search
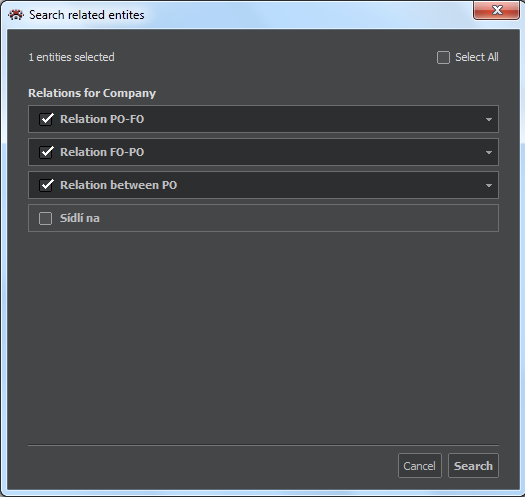
This function offers a possibility to specify conditions for searching in the window that will offer all applicable possibilities. If we leave the window in the default state, the search will look for all links as if we picked the option Search all.
The following figure shows a setting for selective search.
If needed, we can be even more precise. A click on the arrow right of the link's name opens more options,as shown on the following figure.
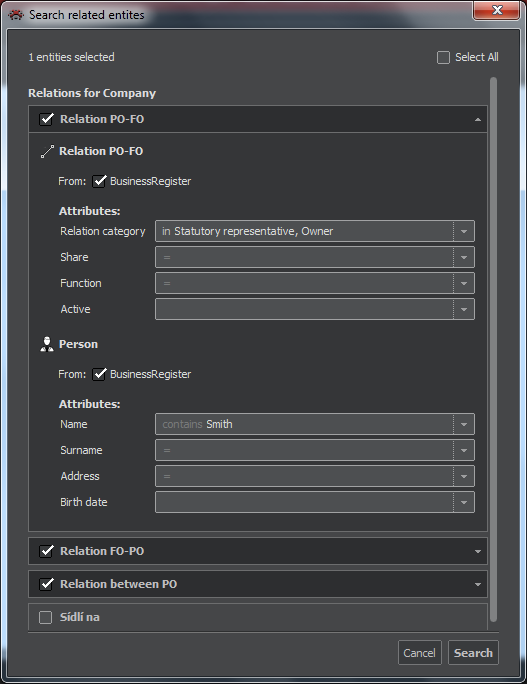
The figure above shows a precision search in which we can specify:
- Conditions for attributes of the link (defined as entity). Links are marked with the symbol

- Conditions for searchable attributes of the node, marked with the symbol of the node type

In both cases, right under the entity symbol and name, the window shows a data source or sources where the entity exists. Using checkmark buttons, we can restrict the search to a specific data source. In conditions for searchable attributes we use the options (=, contains, In) described in the chapter Import from database. Pressing Search will start the execution.
Search all: This function will look for all available links and entities
Active links: The same as Search all, but only links designated as "active" are searched.
Selecting Neighbours
Again, we select a node or nodes. Over a selected node we press the right mouse button and pick “Select” with the offer of Incident nodes, Incident leaf nodes and Incident links. For both nodes options there will be offered a choice of “All incident nodes" and entity types that have links to nodes marked for the search.
The difference between the nodes and leaf nodes is that in the latter case the search will mark only the nodes without any further links. If we want to mark also the originally marked nodes, we should hold the Shift key.
The Incident links option offers choices of “All links”, “Incoming links” and “Outgoing links” as well as a possibility to select a particular type of link.
Highlighting and Deleting Nodes
Highlighting and deleting nodes are other options displayed with the right-click of the mouse over the node. The Highlight function will suppress the display of all unmarked nodes. Upon clicking any part of the graph the highlighting terminates.
The Delete function will remove all marked nods from the graph and data table. It is the same function as the "Delete selected" in the graph pane menu.
Text Search
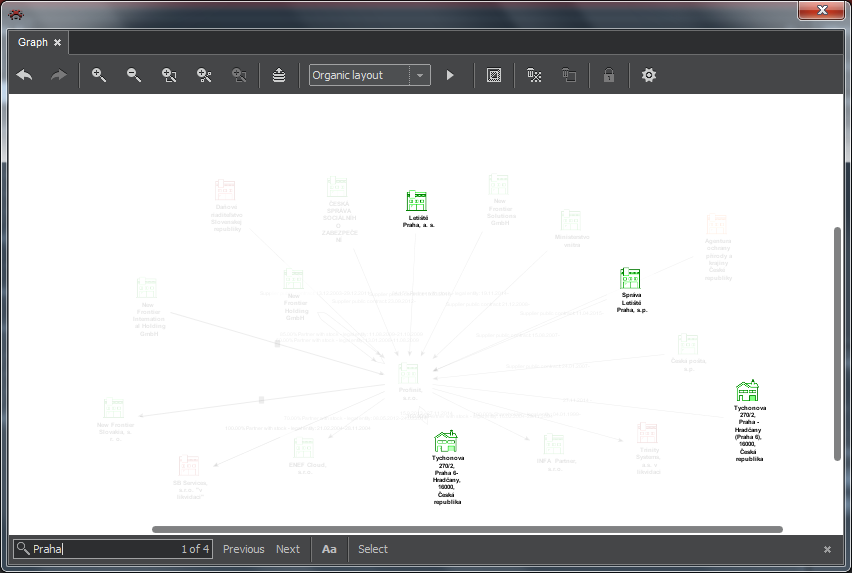
Pressing Ctrl-f in the graph will show the search field, marked with a magnifying glass, at the bottom of the graph window. Once you start typing the text string in it, the program searches the labels on the graph canvas and shows a number of matches, it also highlights the matching nodes by reduced display of the rest. Buttons beside the field work as follows:
- Previous and Next: it will place one entity with the matching string in the middle of the graph. With the help of these buttons you can step through all matching elements in the graph.
- Aa: On/Off switch for distinguishing upper and lower case.
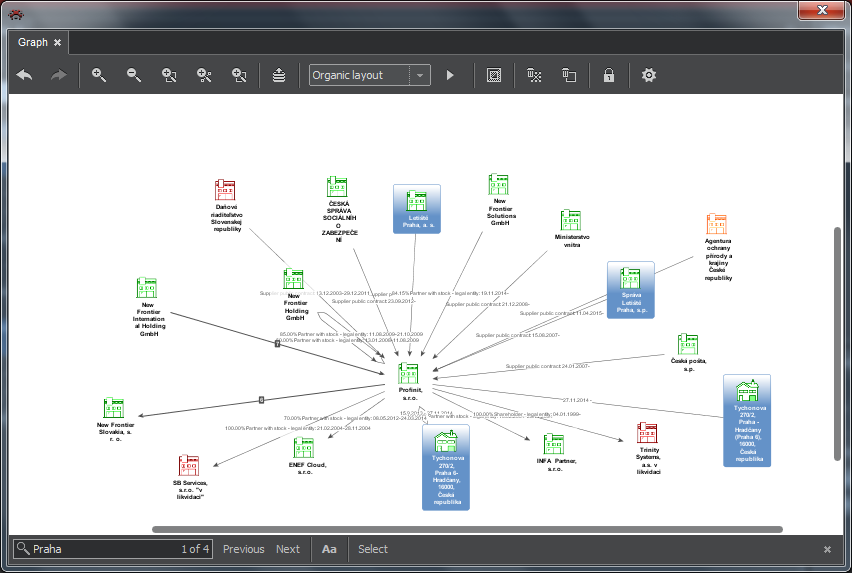
- Select: Discovered item are marked as selected and could be then used for other actions (Delete, Expand ...). The next figure shows a part of graph with found items before and after pressing the button Selection.
Selection of Items in Graph
As it is obvious from previous chapters, marking items as selected has key significance for several operations. You can delete selected items, expand search for related nodes, move them etc. It is often useful to save the selection for further use. Saving, recalling and combining selected components is the purpose of the Selection pane.
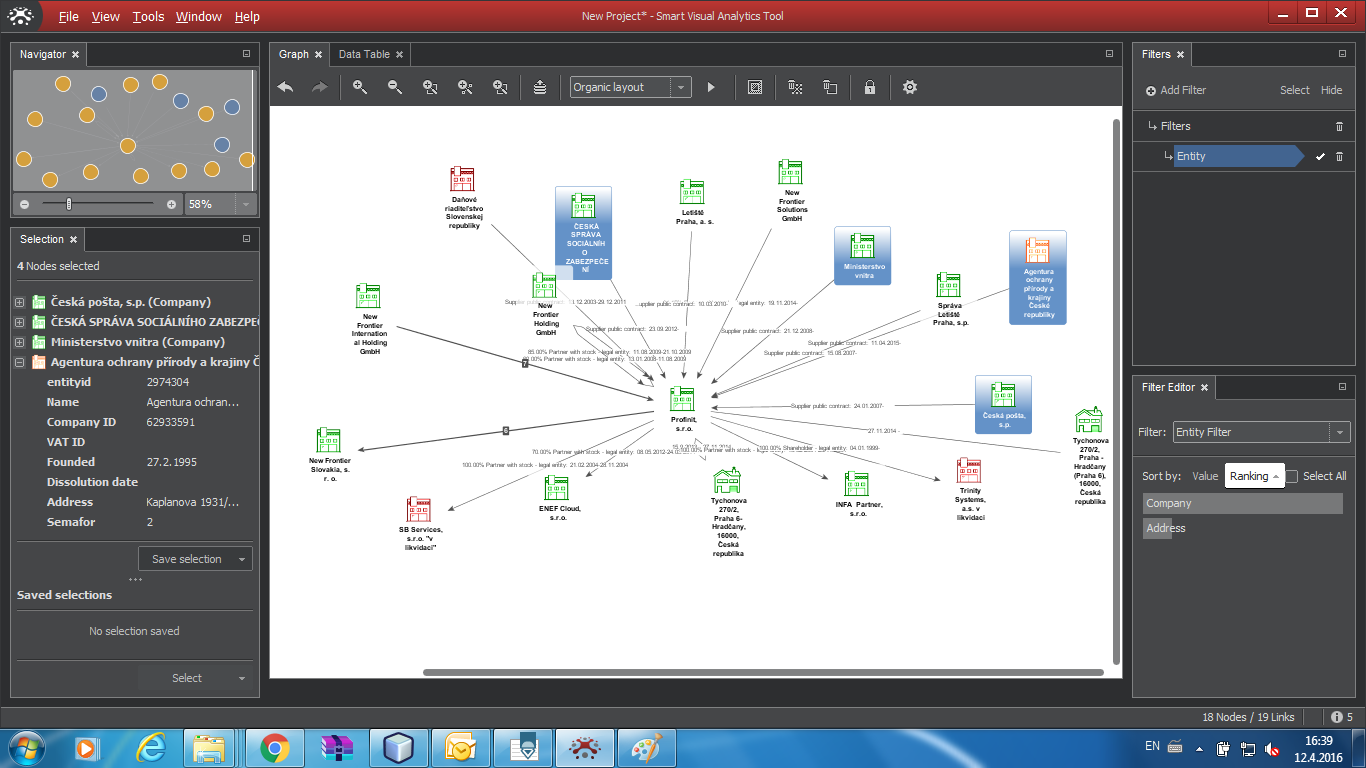
The top portion of the window shows the actually selected items. A single selected item is always shown in detail, with its attributes. For a multiple items, the pane shows their list, while detail of each item is available after clicking on the + sign.
By pressing the Save selection button, the selected set is stored and appears in the lower portion of the panel with the default name "Selection n", where n is a serial number.
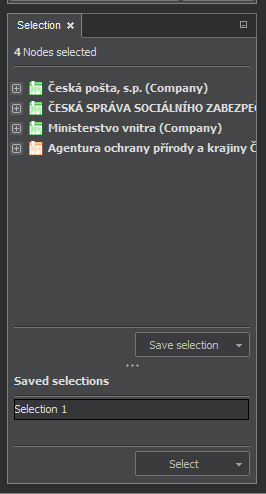
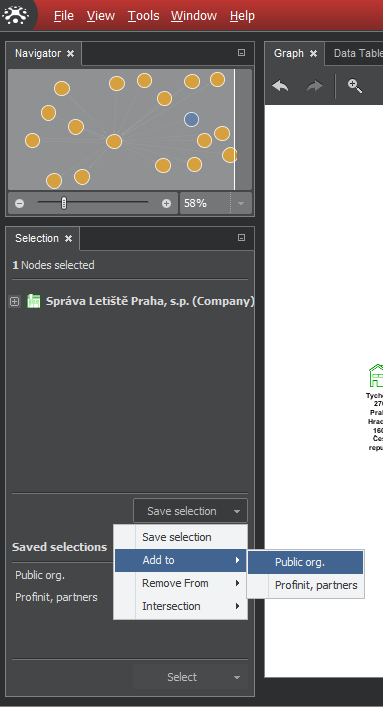
Any saved selection could be reactivated by clicking on its name and pressing the button Select. It is possible to store up to 255 selections. Selected sets can be renamed. It is possible to add or delete items in the set, merge two sets and create their intersection:
Rename selection: a double-click on stored selection opens the name field for editing.
Add selected items in selection: a click on the arrow beside the Save selection offers several choices. The "Add to" option will offer a list of saved sets, click on one to add to it.
Remove selected items from selection: Similar as Add to: select "Remove from" and click on the name of stored selection you wish to remove from.
Intersection: The function Intersection will compare the items of the actually selected set (in the upper part of the Selection pane) with the items of stored set we picked and, in the stored set, it will keep only the items that match.
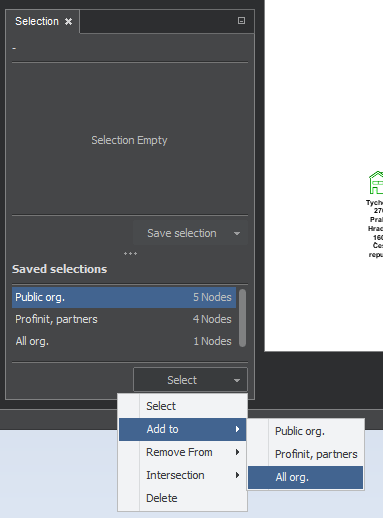
The menu under saved sets works in similar fashion, the difference is that instead the selection in the upper part of the pane, we work - add, remove or intersect - with two stored selection, one chosen first and the second (target) after selecting the function. The following figure shows an example.
Find Paths
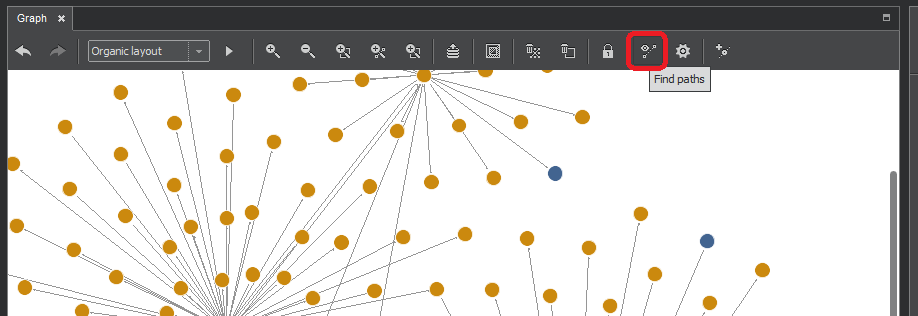
The Find Paths function is used to find the paths between two nodes. The Find Paths button is activated any time when there are just two nodes selected. Pressing it will open the Search Paths pane.
The Find Paths pane offers number of option for the search and the choice of two buttons to execute it as shown on the following picture.
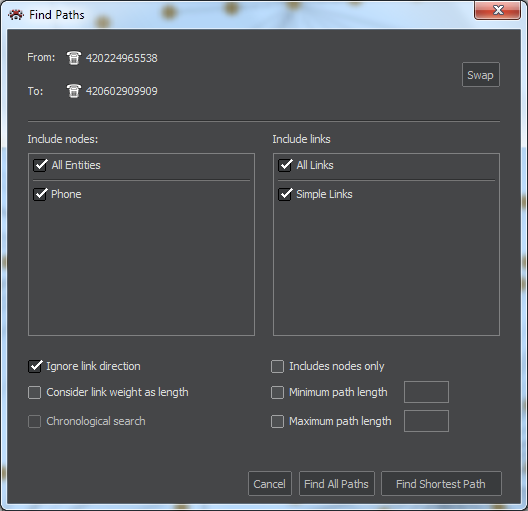
The top of the pane lists the source and target node, if you need to switch them, use the Swap button.
In the Include nodes section, we can either select all entities, or only certain entities to be included in the searched paths.
The Include links section lets us choose the types of links we want to include in the search.
Ignore link direction: when selected, the direction of links will not be considered.
Consider link weight as length: if the graph contains links with different weights, selecting this option will take it into account when computing the paths length.
Includes nodes only: the resulting selection will not include links.
Minimum path length and Maximum path length parameters are filled in if we want to search for the path within these limits
Find Shortest Path: this function will find the shortest route from the source to the target node.
Find All Paths: for this function, you need to specify at least the Maximum path length. It will find all possible ways from the source to the target, taking into account all set criteria.
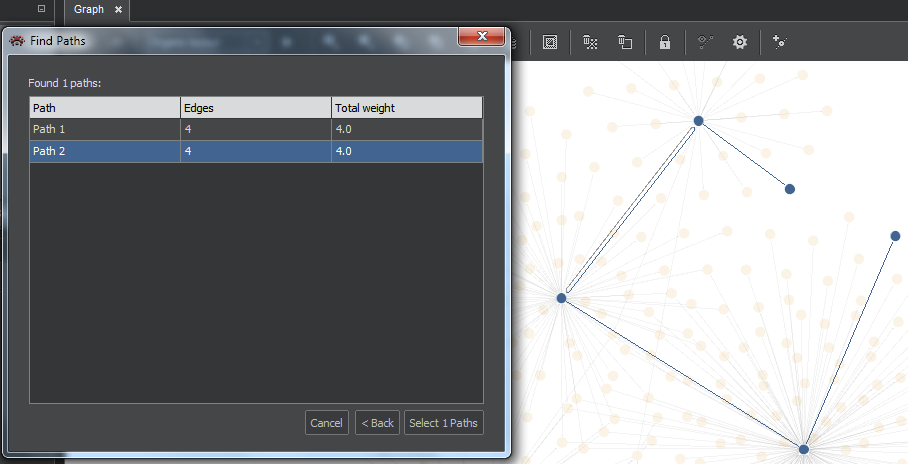
The result of search is shown in the result table, where you can select one or more lines (Ctrl or Shift-Click) to be highlighted in the graph and placed in the Selection pane.
Timeline
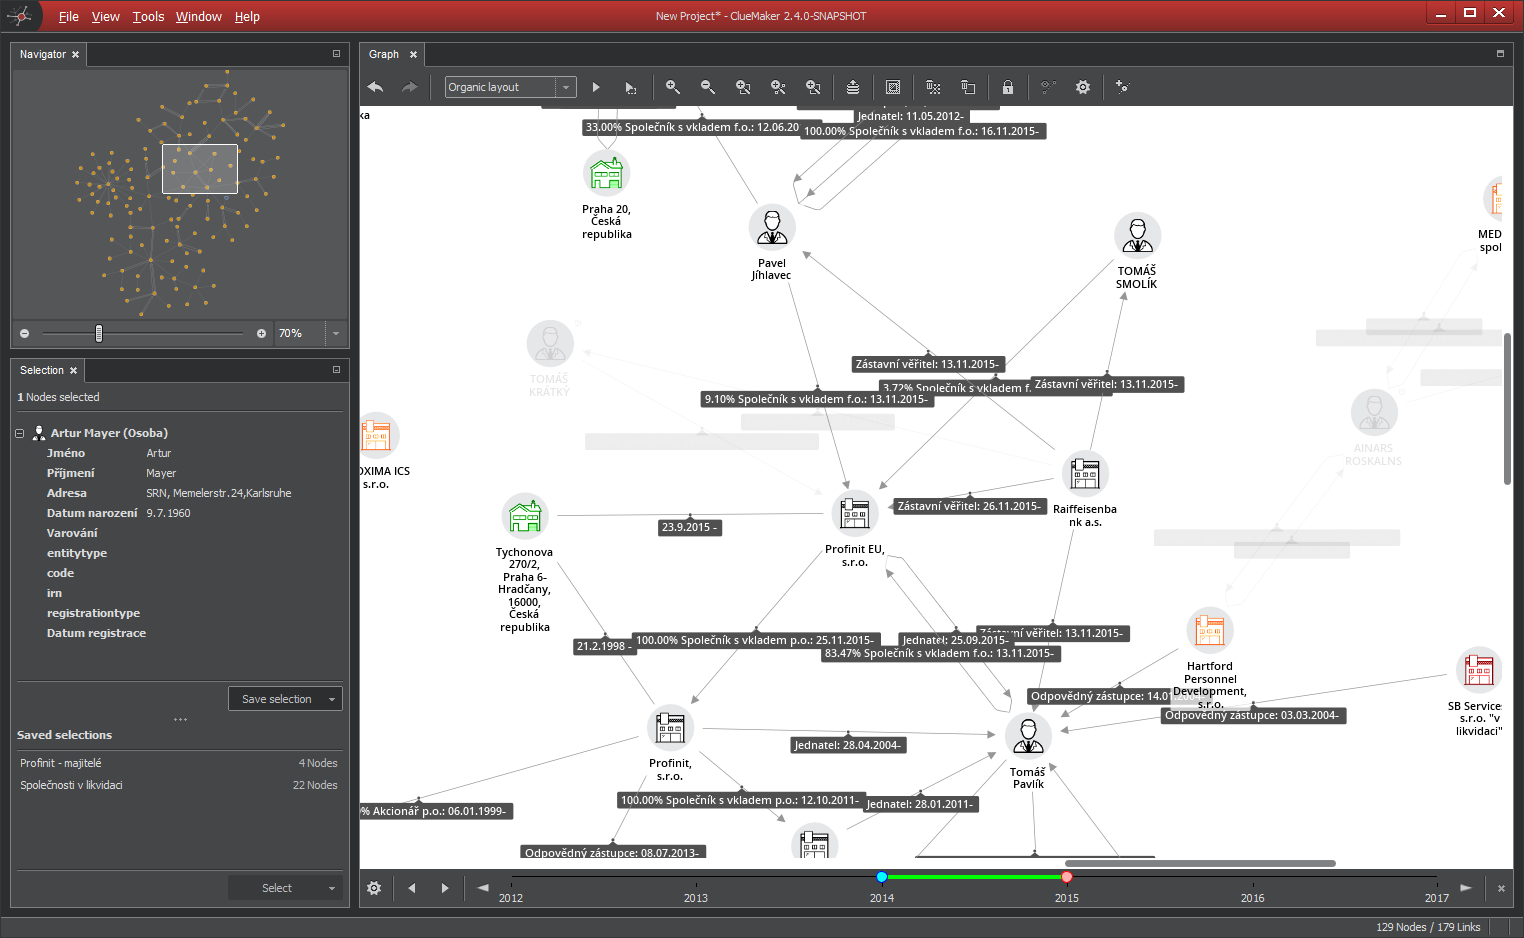
In the main menu choose Tools - Timeline. Then the timeline will appear in the graph window. The control is quite simple - just drag and drop the start and end point. Then the entities, that meet choosen interval will be highlighted. You can control the time interval and size of the step.
Data Table
The command for opening the pane is in the main menu under Window. The data table contains all nodes and links that exist in the graph. At any given moment it is synchronized with the graph. It is also true for selected items - those marked selected in the graph are marked as selected in the table and vice versa.
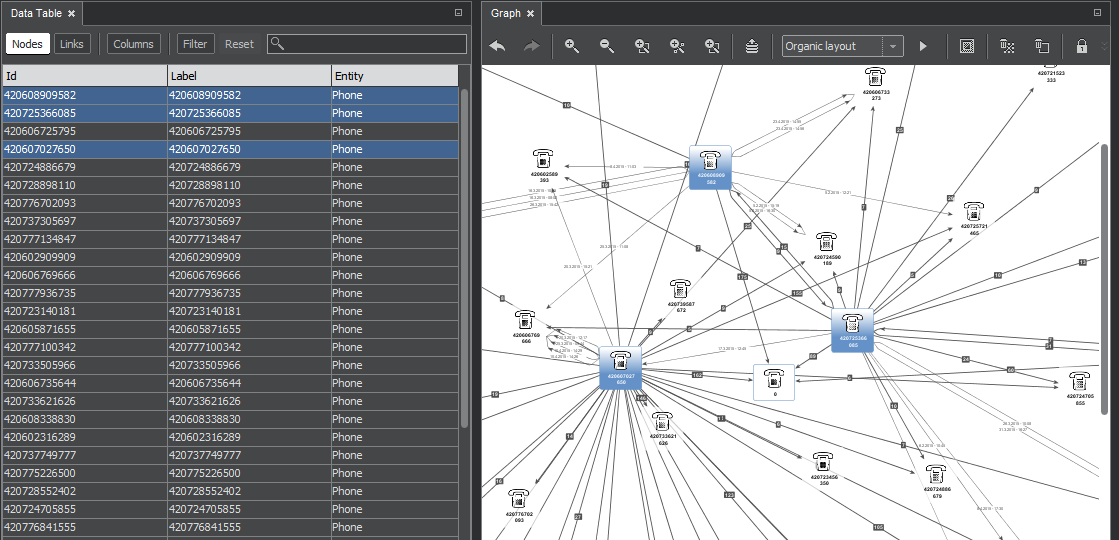
Buttons Nodes, Links and Selected rows open the particular list described further. The button Columns opens a window for adding or removing columns in the list of nodes or links.
Table of Nodes and Links
The pane with nodes or links shows a list of items with their key attributes. The list can be sorted by clicking on the heading of a column. Another click will change the direction of sorting.
Selection of Columns to Show
First, we select the table of Nodes or Links whose columns we want to change. Then, pressing the Columns button will open the pane that controls displayed columns for the chosen list.
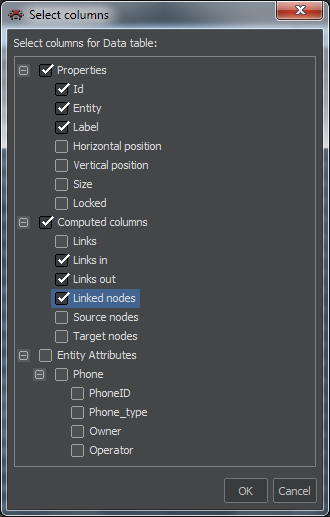
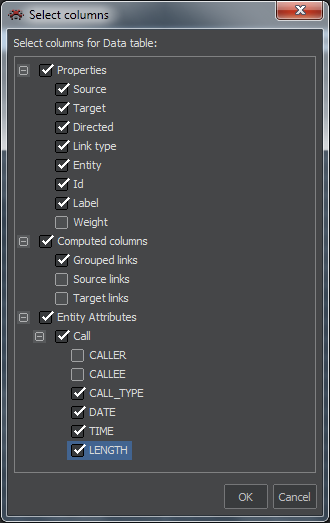
Available attributes are organized in three groups:
- Properties: contain basic identifiers and position coordinates of items.
- Computed columns. In case of nodes, these are number of links and linked nodes including distinction of in/out direction. For links there is a total number of links of the sending (in) and receiving (out) node.
- Entity attributes: These are attributes of a given entity.
Graphs often contain several entities, each with different attributes. If we select some entity specific attributes for columns in the data table, these columns will be filled only for item that contain their attribute.
List of Selected Entities
We select the table of nodes or links. If the chosen table has some selected item, the button Selected is activated, and pressing it will open the window with the list of selected rows only. The button Show all will return to displaying all lines.

Filters
Filters are used for finding nodes based on combination of various criteria. Filtered nodes could be selected for further action or shown in the graph while the rest will be hidden. Filtering action is instant, as it works with already imported data. Filters do not remove any nodes.
For filtering, we use two panes described below. There is one special type of filter - Timeline.
Filters Pane
The pane is used for adding and arranging filters. Every click on the + Add filter button will add one filter that we subsequently define in the Filter Editor pane, described in the following section. When using several filters, we need to specify their relationship, either logical OR or AND:
For logical OR we can leave filters as they are after adding. The following figure shows such arrangement in which the items matching either the first or the second condition will be picked.
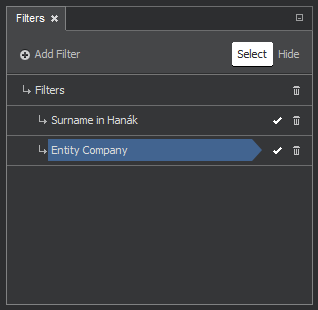
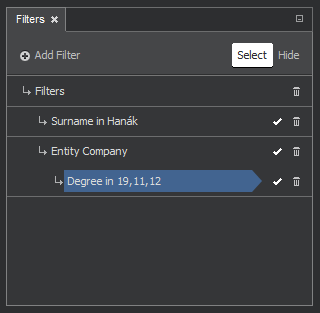
For logical AND we need to rearrange the filters by dragging one of them under another. The next figure shows such an example - we added the Degree filter and placed it under the entity filter (Company). The filtered nodes must satisfy both conditions - only the chosen entity type with specified degree (number of links) will satisfy the filtering conditions.
In the Filters window we also control turning the filter off/on or its deletion. This is done by clicking on the checkmark or garbage bin symbols beside the filter name.
The effect of filters on the graph is controlled by the following buttons:
- The button Select will mark nodes that match the filter criteria as selected.
- The button Hide will hide all other nodes except those matching the filter criteria.
Filter Editor pane
In the Filters pane, we select the filter by clicking on it, than move to the Filter Editor to define it. The Editor offers following types of filters.
Entity Filter
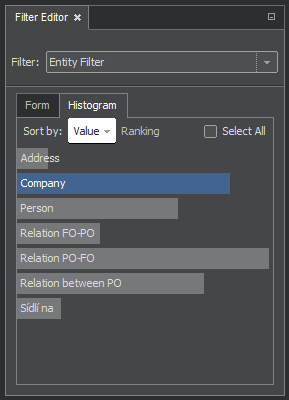
The Entity Filter, as the other filter types, has two tabs for different ways of selecting the filtered values. In the Form, we can enter directly the value or values we want to find. It is useful when the list of possible values is long, as will be shown for the attribute filter. The Histogram tab shows the list of all available values. The list can be sorted and our selection of desired value(s) is made by clicking and highlighting the name on the list. The checkmark Select all can be used for selecting/deselecting all values.
Attribute Filter
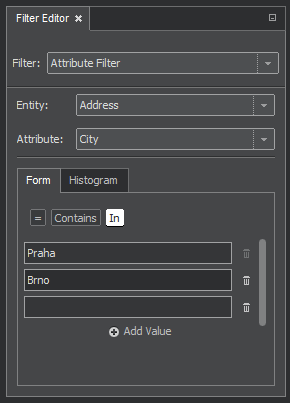
In the case of attribute filter, we specify the entity and its attribute and select the attribute values.
Let's use the Form tab this time. The tab offers three choices for entering values: [=] for one exact value, [Contains] for a string occurring anywhere in the attribute value, and [In] for specifying multiple exact values, as shown on the next picture.
Degree Filter
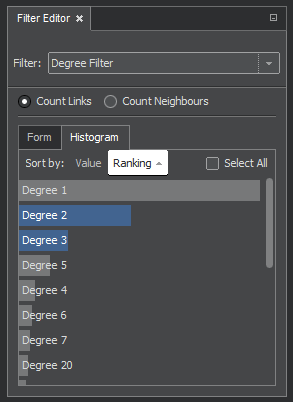
The degree filter is based on a number of links or neigbours of every node in the graph. The choice is done by radio buttons:
- Count links: this option counts links of every node. As there could be multiple links between two nodes, the numbers may differ from the number of neighbours.
- Count neighbours: this option counts neighbours of every node.
The Histogram tab will show a list of all discovered values. A displayed item, e.g. "Degree 2", means that in the graph there is at least one node with two links or neighbours. A choice of values for the filter is done the same way as for other filters.
Links Filter
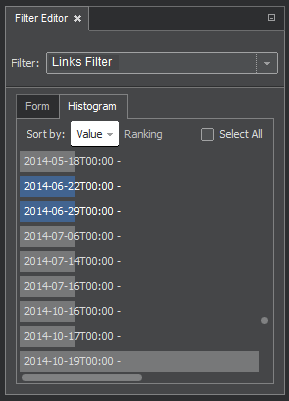
The Links Filter uses the values of link labels for filtering.
As with the other filters, we can use either the Form or Histogram tab. The latter case is shown on the picture.
Timeline
Timeline is special type of filter. First you have to define start date and end date of filtered entities. Then you can use the timeline to filter entities. You can define the step for moving left and right. Nodes are only highlighted, so the timeline is not deleting any node.
Creating Your Nodes and Links
The application offers a possibility to add your own nodes and links to the canvas. You can start painting on the empty canvass or add these components to an existing graph.
Creating Nodes
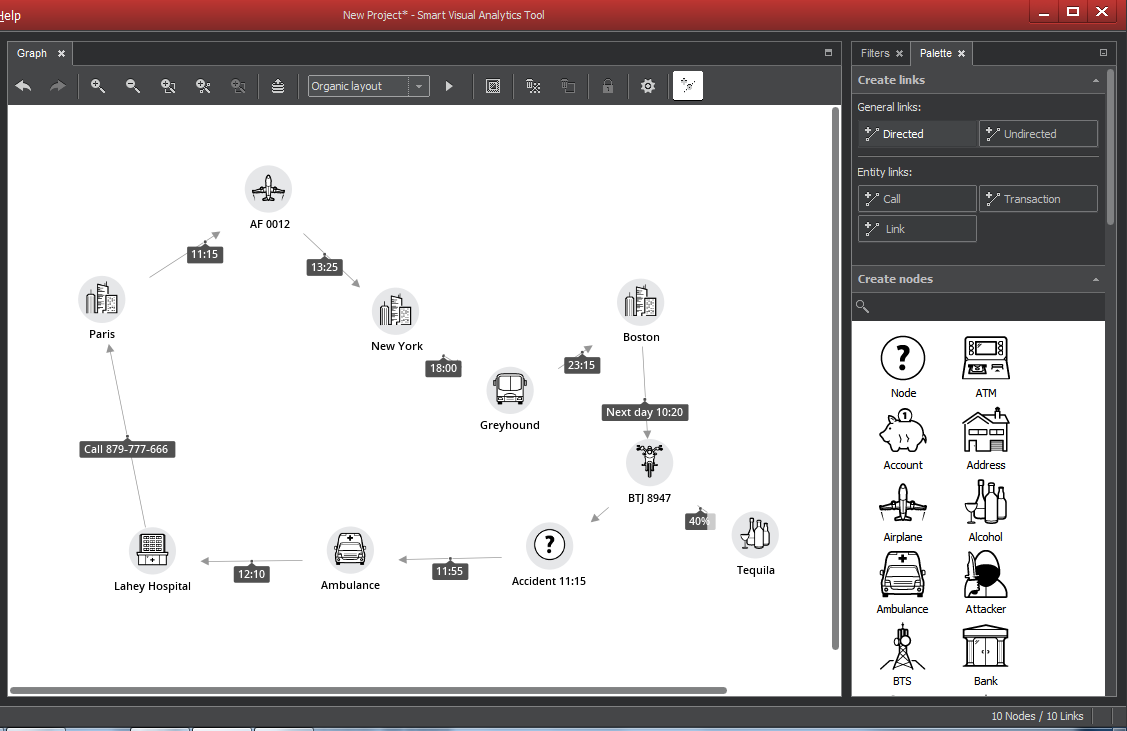
On the Palette pane, the sub-pane Create Nodes offers a choice of icons associated with nodes. A node is added either by clicking on the icon and then on the canvass, or by dragging the icon onto the canvass
Once it appears on the canvass, you can modify its label by doubleclicking on it and editing the text
Creating Links
The Create links sub-pane, offers a choice of several types of links. Either the simple directed or undirected links, or several entity links that will have additional attributes (The call, transaction ...). Offered entity links depend on workspace selected for the session.
To use the link to connect two nodes, click on the type of link and then drag the mouse from one node to the other. You may edit link labels the same way as the labels of nodes
Reports
For online data sources, typically SQL databases or data accessed using web services, ClueMaker can execute stored reports that will show information in a user friendly tabular form or as a diagram.
There are two types of reports: Entity reports - the reports linked to entitites in the graph; and general reports - those without a link to graph.
Entity Reports
The Report option is in the context menu displayed with the right mouse click on any of selected nodes. Note that the option is enabled only if the graph contains an entity type linked to one of the stored entity reports.
When chosen, it offers available reports. Once the report is selected and executed, ClueMaker will display its results on a separate pane bearing the report name as shown on the next figure.
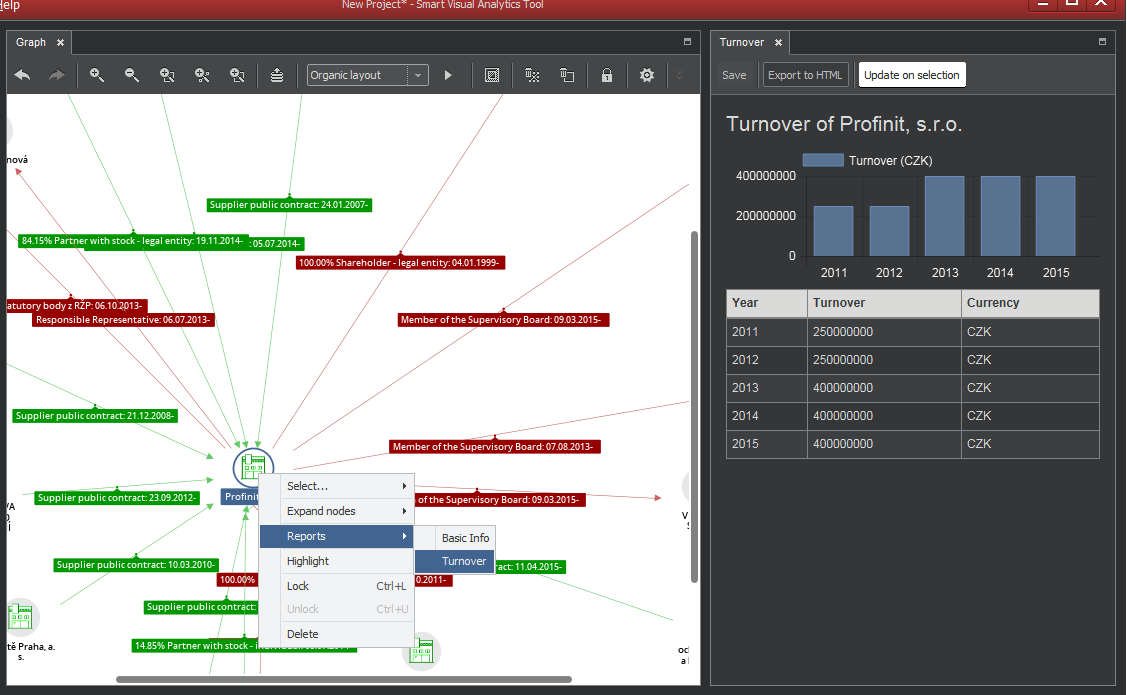
The highlighted button Update on selection means that the report will be updated for any newly selected node. The button Export to HTML allows you to store the current report as the html file.
General Reports
To execute general reports, in the main menu select Tools > Execute report ... This will open the window offering all reports not linked to a particular graph entity.
Depending on the report definition, the chosen report may prompt for one or more parameters.
The results are presented the same way as for the entity reports.Working with GIS and Map
Part of ClueMaker dealing with graph visualization on maps consists of 2 parts: main map panel and map layers panel.
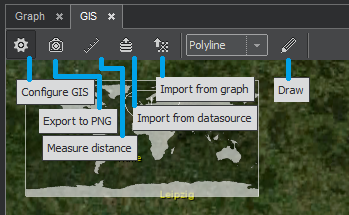
In addition to the map, the GIS screen includes a toolbar, where you can launch:
- configuration dialog,
- export of currently visible part of map to PNG image,
- distance measurement toolbar,
- import of entities according to their locality from datasource to graph or from graph to map,
- shape drawing.
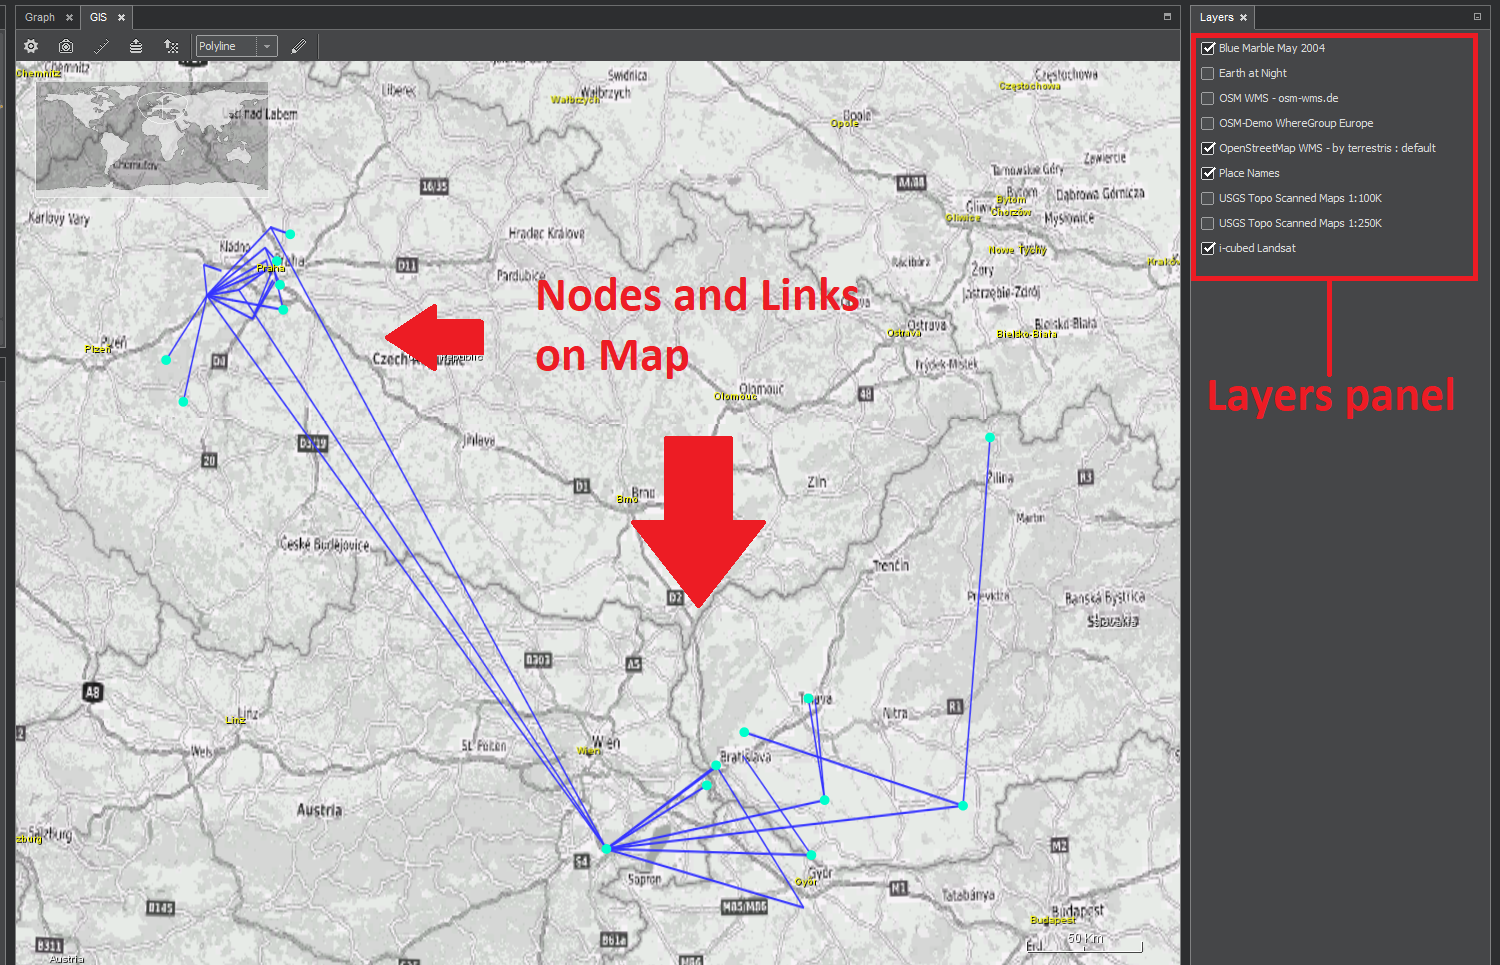
The Layers panel is located on the right side of the screen and contains layer checkboxes that determine whether the layer is displayed on the map.
Nodes and Links
As well as in the graph, nodes and links are displayed on the map. The nodes are either placed in a location that is mapped in attributes or, when it is not defined, in a random place near a position that can be modified in the configuration.
There are 2 modes of displaying graph on the map:
- a simple mode, in which the nodes are displayed only as dots and if the nodes have multiple edges between them, they are shown as one,
- full mode where all edges are displayed and the nodes have their icons as in the graph.
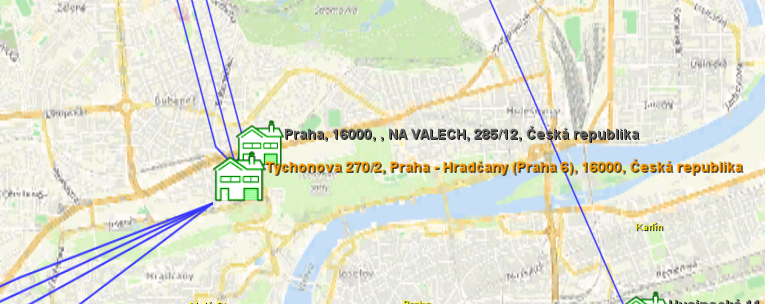
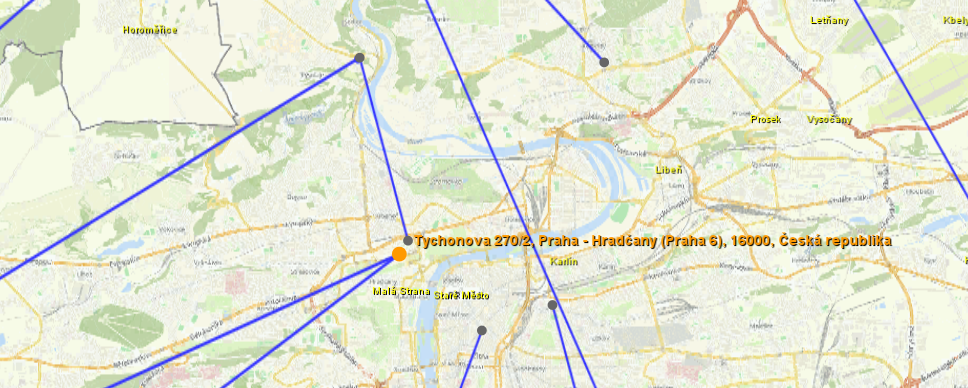
Both node locations and the currently displayed map area are saved with the project.
Inserting Nodes from Graph
Nodes can be inserted from the graph by selecting such action from the context menu that can be invoked with the right mouse button, and either the selected nodes or all nodes that have a geographical location can be added.
Import according to Locality
Entities can be imported from the graph to the map or from the data source to the chart. These actions can be triggered either from the toolbar at the top of the screen, or from the context menu of the drawings or of the highlighted distance from node.
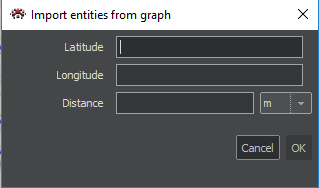
When importing from a toolbar, it is necessary to specify the coordinates and the distance by which the circle is created with the specified center coordinates and the nodes that are inside the created circle are imported.
When importing from a context menu of a drawing or highlighted distance from the node, the entities that are inside the drawing (or highlighted distance) will be imported. If the import has been invoked from the polyline, the user will be asked to fill in the distance from the polyline from which entities are to be imported.
Drawing Shapes on the Map
Different shapes can be drawn on the map, such as circle, ellipse, or a polyline. Drawing is triggered by clicking drawing button on the toolbar at the top of the screen. The type of drawing can be selected using the drop-down list next to the drawing button. To finish drawing, you need to click the drawing button again. You can delete a drawing from the map using the appropriate option from its context menu. Drawings can not be saved within a project.
Configuration
The GIS configuration can be invoked from the toolbar at the top of the screen. In this configuration, you can set the colors of the nodes, edges and their labels, for example. You can also change the colors of the drawn shapes and the distance measurement (poly)line. The elevation of the view at which the displaying mode is switched from full to simple is also set here. There are also settings for managing map sources and map layers.
Map Sources Management
In this section of the configuration there are individual server tabs - map layers sources. These tabs contain checkboxes for all map layers provided by the server. Layers with the checked box will be available on the Layers panel, from where they can be selected and displayed on the map.
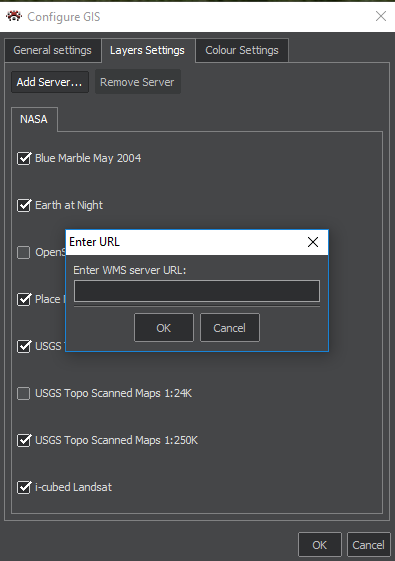
The servers themselves can be added by clicking the "Add server" button, which will invoke the dialog for entering the URL of the respective server. After filling in and confirming that dialog, if given URL is running a supported server (WMS), new tab is created with the layers of that server. You can delete the added servers by using the "Remove Server" button to remove the server on which tab is user present. This action removes all the layers provided by the affected server.
The added servers and the selection of layers on the layers panel are stored together with the project.
Events layout
After you select one or more nodes, right-click and select option "View events", it is possible to visualize interactions in time between chosen nodes - their events. This visualization is useful e.g. for investigating money moving among different bank accounts, or creating sequences of calls among telephone numbers. With this layout you can also use timeline, which highlights nodes valid in picked time period.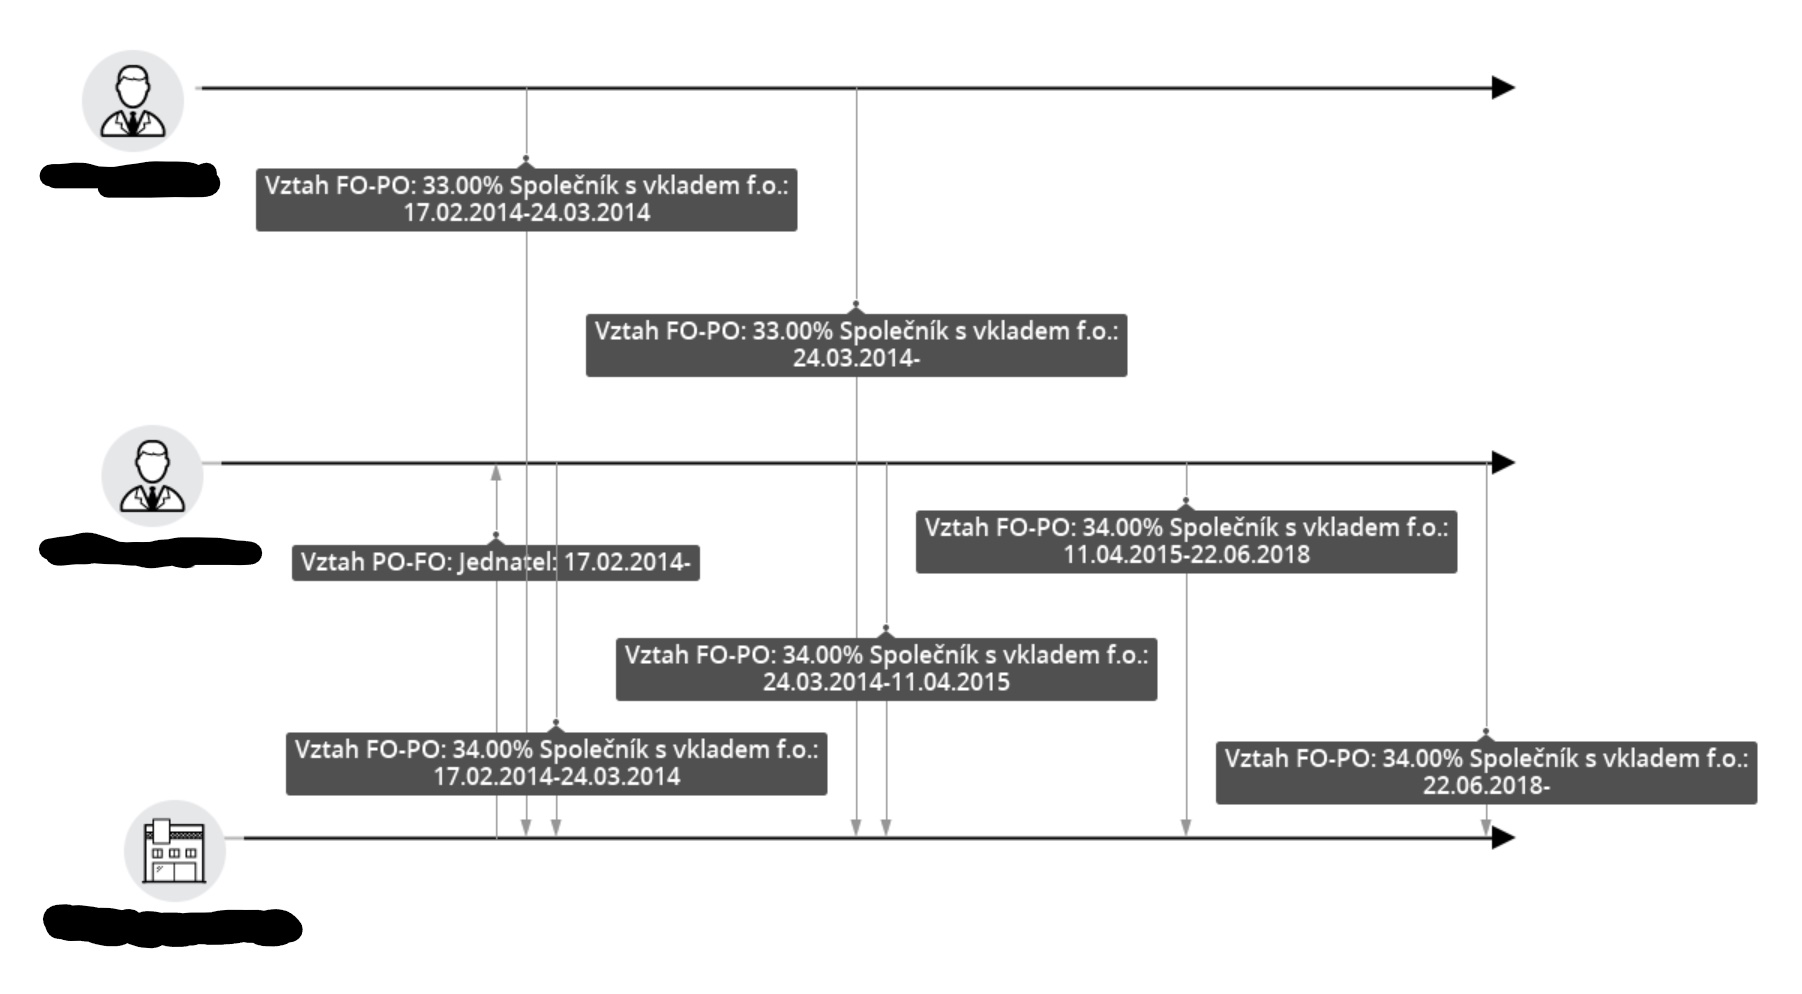
Picking entities for events
After clicking option "View events", a wizard is opened, where you can choose entities, which represent some type of event, that we want to investigate.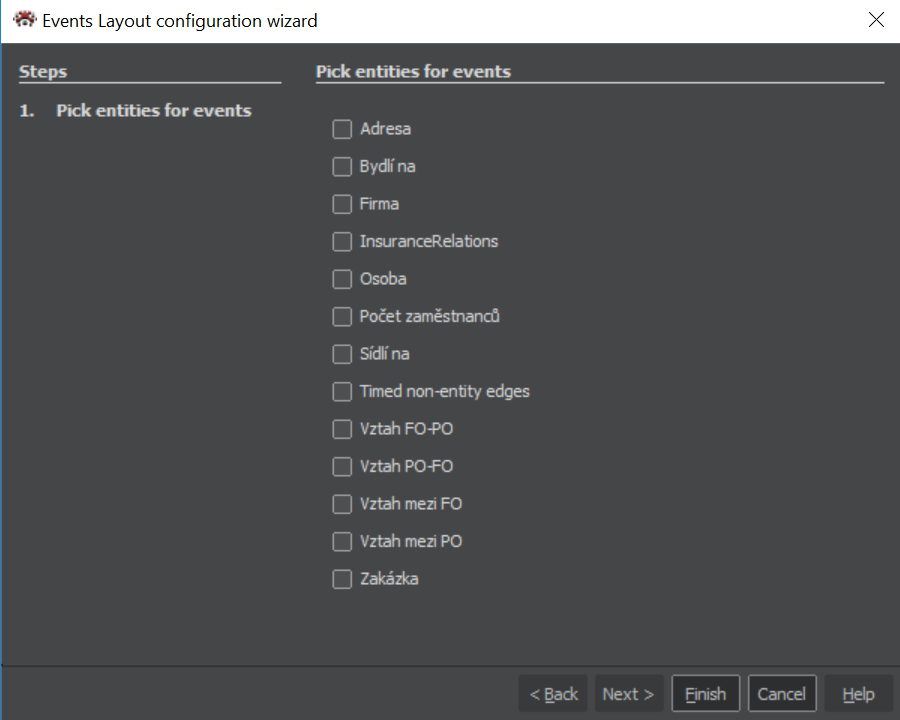
Configuration
Layout is configurable, it is possible to pick type of layout - regular, or proportional (to time distances between events). It is also possible to pick only date range that interests you.Saving and Retrieving Project
Saving project
The command for saving a current project is in the main manu under File > Save Project or File > Project > Save Project As. This will open a standard window for saving files where we give the file a name and specify a location. Saved ClueMaker project files have the extension spr.
We can also save project any time by pressing Ctrl-S.
Opening Project
The function for opening a saved project is in the main menu under File > Project > Open Project, or we can call it by Ctrl-O. If the current session contains any unsaved changes, the application displays a prompt for saving it.
Upon opening a project, the application will show the project data - graph or table in the state it was when saved. If you want to work also with the original data source, for example to expand nodes, you have to open an appropriate workspace.